![]()
Home ![]() Pre Katrina Home
Pre Katrina Home ![]() Articles
Articles ![]() Numbers
at the neighborhood level talk even louder
Numbers
at the neighborhood level talk even louder
 Numbers
talk... and at the neighborhood level they may talk even louder!
By using data about your specific neighborhood compared to the surrounding area, you can make a compelling case for funding.
![]()
| by Allison Plyer |
Jan. 21, 2002 | If you’re running a neighborhood-based organization, how can you convince a funder who’s never been to your neighborhood that your services are vitally needed?
You probably already know that when you’re writing a grant proposal, showing numbers that reflect the problems in our community can really be convincing. The New Orleans area tends to suffer from problems to a greater degree than most of the rest of the nation. We have higher rates of poverty, greater numbers of vacant houses, higher rates of disease, and poorer academic achievement. Using almost any indicator, you can show that the New Orleans area is worse off than the rest of the nation. These numbers really talk. But, numbers at a neighborhood level may talk even louder!
Example with single-parent households
Consider this example. According to the 2000 Census, 17.7% of the households in Orleans Parish are children living with single moms. This compares to 8.4% of the households across the U.S. (The remaining households are single people, elderly, married, etc.) So clearly in the New Orleans area we have a greater than average number of families headed by single mothers. This number can help make a compelling case for services like childcare and tutoring in this parish.
But did you know that in certain neighborhoods more than 50% of the households consist of families headed by single mothers? Yup. More than 50% of the households in most of our housing developments are single parent families. And single parent families make up 20% - 49% of the households in many other neighborhoods like West Lake Forest in New Orleans East and Central City, to name just a couple. Given the difference between the numbers at the parish level and those at the neighborhood level, it makes good sense to present both to your funder - that way you're showing that your neighborhood needs money more than other neighborhoods.
Example with household income
Here’s another surprising number. According to Census 2000, the average household income in Orleans Parish was $43,176. That doesn’t sound too bad, does it? But, it probably does not reflect the reality you see every day in your neighborhood. Well, that’s because there are some parts of Orleans Parish where people are really wealthy. When we average the wealthy neighborhoods with the poorer neighborhoods, we get a pretty high income for the parish overall.
So if you want to make a case for your services by showing the limited income that folks must live on, you don’t want to look at parish level numbers. You want to look at numbers that reflect the neighborhood where you work. And that’s smart, because the average household income ranged from $7,279 in Iberville Development to $153,990 in the Lakewood neighborhood according to Census 2000.
|
|
Defining your neighborhood
To make a really compelling argument for funding your organization, you’ll want to find some numbers that represent your neighborhood.
First you have to think about where exactly your neighborhood begins and ends.
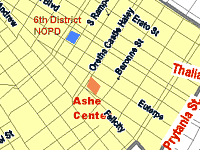
For example, if you consider your neighborhood to be the Lower Ninth Ward, then let's get specific. What are the boundaries of the Lower Ninth Ward more or less? In your mind's eye, you might be picturing something like St. Claude to Florida Ave and the industrial canal to Delery or maybe the St. Bernard Parish line.
|
Neighborhood boundaries aren't always agreed upon. Learn more... |
It’s good to be a little flexible in your definition of the boundaries of your neighborhood, because the easiest way to pull together data about a neighborhood is to use definitions that already exist. If you use neighborhood boundary definitions that other people have used to pull together data, then they’ve already done half the work for you. (More than half the work, really. If you try out the two options below, you’ll see how much work it is to develop new neighborhood definitions!)
If you want to use some pre-established neighborhood boundaries based on the City of New Orleans’ definitions of neighborhoods, click here to read about how they are defined.
If you find the neighborhood definition above too big or too small, you might want a different grouping of census tracts. You can click here for a step-by-step guide to figuring out what census tracts cover the area where you work.
Compare across geographic levels
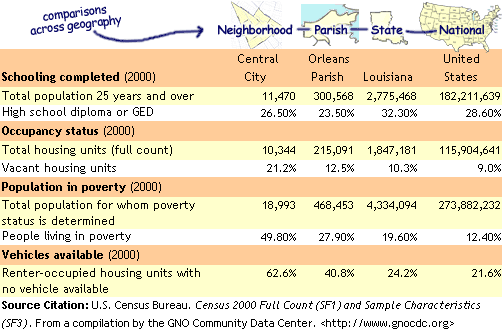
Now you need to decide what kind of data will help prove the need for your services. Do you want age, single parent households, or vacant housing units? It's a good idea to pull together these numbers at the neighborhood level and then some larger region for comparison. Whether you choose to compare data about your neighborhood to the parish, state or national level depends on what region your funder covers and how your argument for need is developed. In the table below, we show numbers for the Central City neighborhood compared to the parish, state and national numbers.

As you can see in the table above, pulling all these numbers together creates a compelling neighborhood profile. For your neighborhood profile, it might make more sense to only compare to one other geographic level to keep things simple and relevant.
Good news for local nonprofits...
The Community Data Center has data profiles for all 73 neighborhoods in Orleans Parish. We put data from both the short and long Census forms in one place. That way it's easier for you to find what you need. Go to the Data Center home page to check it out.
Home ![]() Pre Katrina Home
Pre Katrina Home ![]() Articles
Articles ![]() Numbers
at the neighborhood level talk even louder
Numbers
at the neighborhood level talk even louder
![]()
|
Greater New Orleans Community Data Center
Last modified: February 19, 2003 |