Coming into focus: Early indicators of pandemic job loss in the New Orleans metro area
Published: Jun 17, 2020
Recently released labor market data brings the pandemic’s impacts on the regional economy into greater focus. This brief unpacks unemployment insurance claims data through early June and preliminary employment estimates for April from the Bureau of Labor Statistics. The data paints a picture of the scale of pandemic job loss in the region.
Two months have passed since the initial shock of pandemic unemployment numbers in late March and early April. Reports by The Data Center, as well as countless other media outlets and national commentators, have highlighted alarming early reports of unemployment and dire projections of further job loss. This brief provides an updated look at data from the state unemployment insurance system through early June. In addition, we examine recently released preliminary1 April estimates for state and local employment from the Bureau of Labor Statistics (BLS).
Early back-of-the-envelope estimates using data from before COVID-19 suggested that the New Orleans labor market would be especially vulnerable to job loss, in part due to the importance of its tourism industry. Based on post-COVID-19 data, early indications show that these fears were well-founded and underscore the precarity of workers and businesses that may face a slow and uneven recovery. While it must be stressed that estimates from different sources vary due to differences in methodologies and reference periods2 and many unknowns remain about current stresses and the outlook for recovery, the numbers reported below begin to paint a clearer picture of the scale of joblessness affecting the regional economy.
Unemployment claims data: A murky but close-to-real-time benchmark
Every week since late March has brought astronomical reports of workers claiming unemployment insurance (UI) benefits. Unemployment insurance provides a useful leading indicator of joblessness for two reasons. First, unemployment claims directly reflect utilization of the primary social insurance program for people experiencing short-term unemployment. Second, unemployment insurance claims data is published with a lag of only 5 days – far less than any other conventional indicator of labor market conditions. Initial and continued claims published by the U.S. Department of Labor and the Louisiana Workforce Commission remain the timeliest readily available indicator of joblessness.
Initial versus continued claims: “Initial claims” refer to the number of claims for unemployment benefits filed during a given week. This is a leading indicator of emerging unemployment, but it tends to be volatile and is not the same as the number of people who receive benefits. “Continued claims” (or “insured unemployment”) refer to the number of unemployed people who continue to claim weekly benefits after initially filing. Continued claims tend to accumulate as more initial claims are filed, though recipients who find a job or exhaust their period of eligibility would fall out of the weekly tally of continued claims.
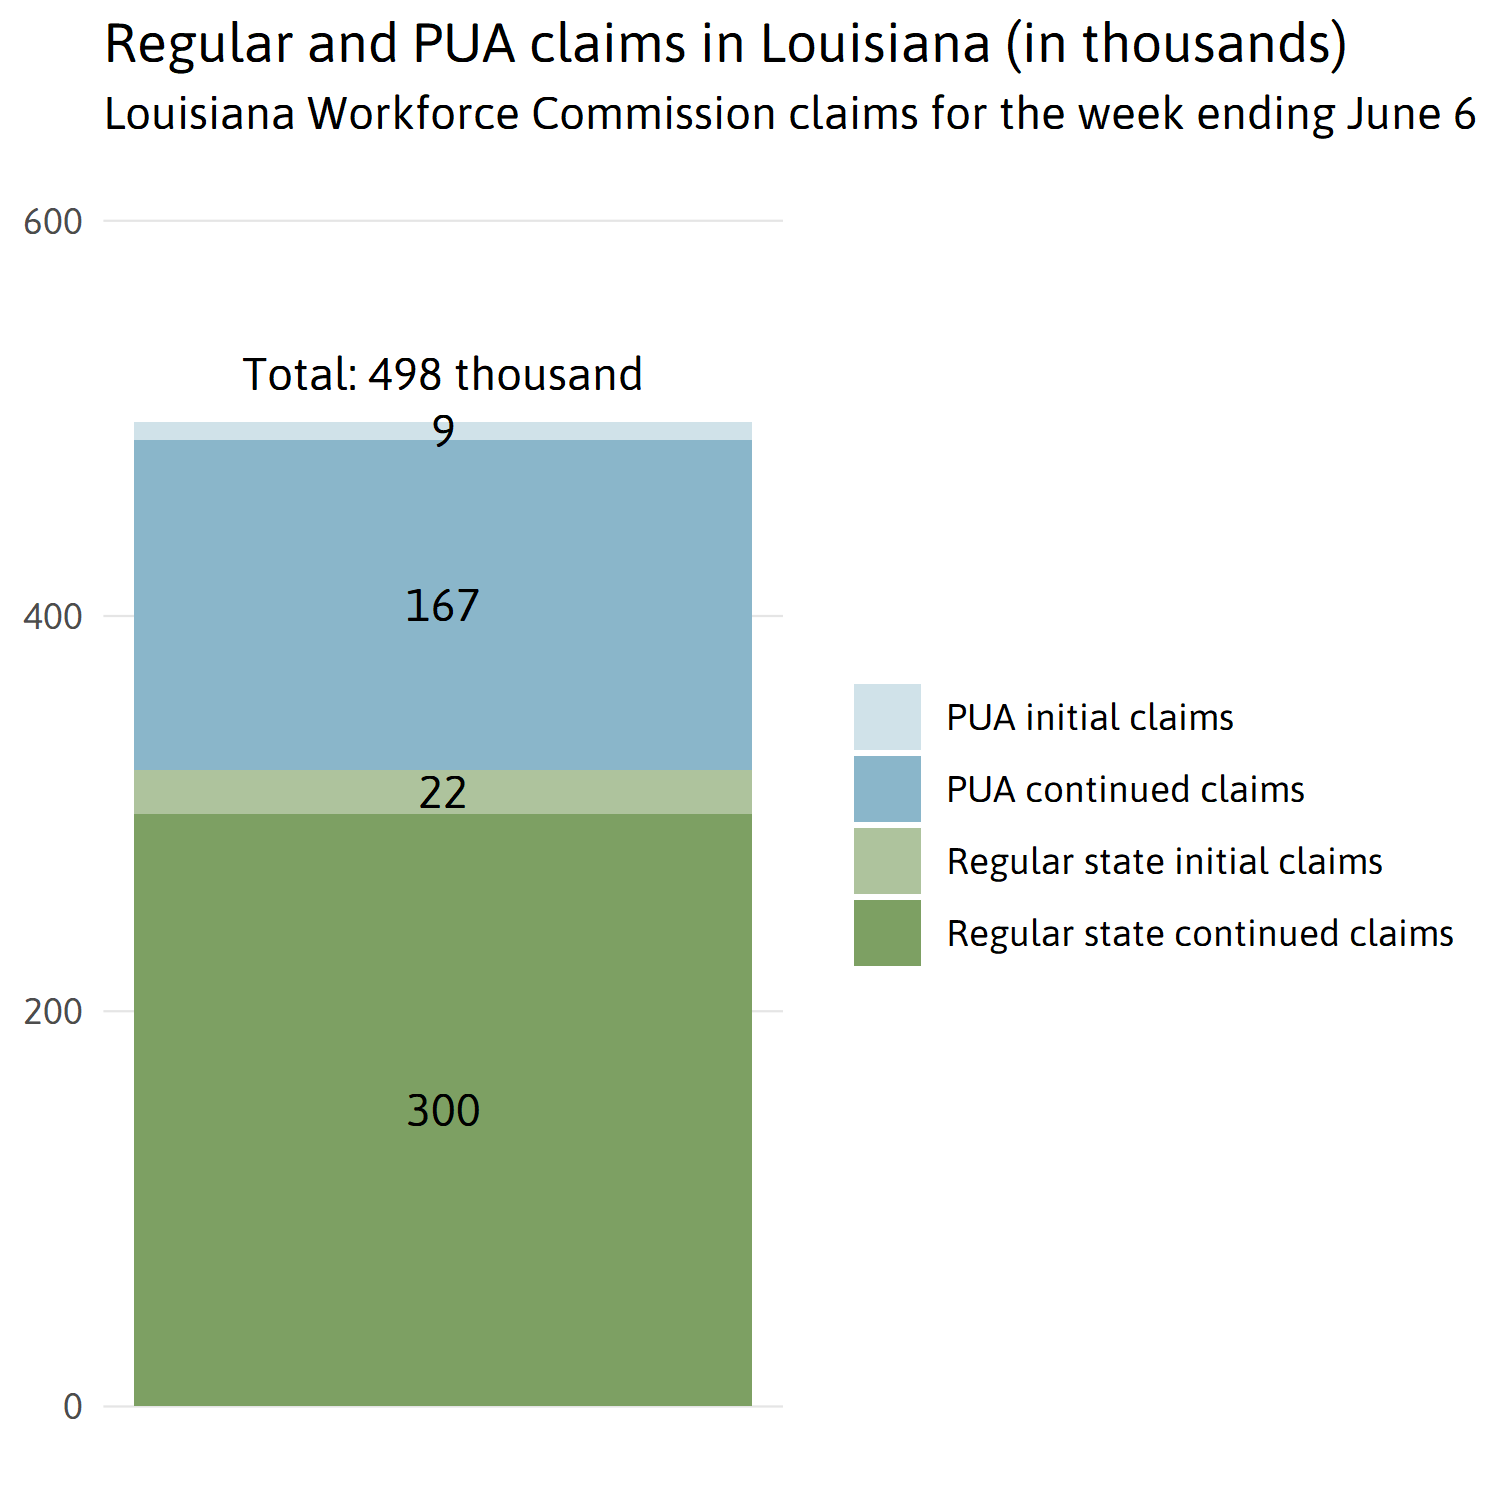
At the start of June, roughly 498,000 Louisiana workers were claiming unemployment benefits. Of these, roughly one-third were part of the new federal program that extends eligibility to jobless workers who typically are not eligible for benefits.
Since the initial effects of the pandemic on the labor market, many media stories have reported the cumulative number of initial state UI claims as a measure of joblessness. However, this may be misleading since it undercounts claims for Pandemic Unemployment Assistance (PUA).3 As a provision of the CARES Act, the PUA program extends UI benefits to jobless workers who are not typically eligible for regular UI. In practice, this means self-employed people, including independent contractors, “gig” workers, and those with insufficient work experience qualify. This group may be more likely to reflect claims by musicians and other cultural economy workers who are more likely to be self-employed, 4 as well as those with non-standard or part-time employment.
By adapting a national analysis by the Economic Policy Institute to state-level data, we can begin to paint a clearer picture of the unemployment insurance situation in Louisiana as of early June. For both regular state claims and PUA claims, the figure below covers claims that have gone through the initial round of processing and are eligible for benefits (continued claims), as well as claims that have been submitted but not gone through the initial round of processing and are waiting to see if they will receive benefits (initial claims).5 For the week ending June 6, this adds up to 498,000 claims in Louisiana, about one for every four workers covered by unemployment insurance before the pandemic hit Louisiana. PUA claims make roughly one-third of this total.6
The extra $600 per week benefit is slated to end at the end of July, but workers who first received benefits during the surge of claims from mid-March through May should have access to benefits through the end of the calendar year.
Arguably, temporary modifications to the UI system have been among the most effective provisions of the CARES Act, ensuring the livelihoods of hundreds of thousands of Louisiana workers whose jobs were disrupted by the pandemic. However, given widespread uncertainty about labor market conditions over the next several months or even years, the eventual sunset of benefit eligibility has the potential to destabilize the finances of thousands of workers in the region.
As of this writing, the additional $600 per week benefit available through the Pandemic Unemployment Compensation program (PUC) is scheduled to end on July 31. Without this boost, the maximum UI benefit available to local unemployed workers is $247 per week, and Louisiana remains one of only six states with a maximum less than $300.7 At that baseline level of benefits, another CARES Act program, Pandemic Emergency Unemployment Assistance (PEUC) adds an additional 13 weeks of eligibility to Louisiana’s usual maximum of 26 weeks. From mid-March through April, continued claims at the state level exploded, but the curve began to flatten during May. A back-of-the-envelope projection would suggest that, with the PEUC extension, benefit eligibility will begin to be exhausted in December and January for the wave of workers already rendered jobless.
While a share of the over 460,000 Louisiana workers currently receiving UI benefits will likely return to work before the end of July and the calendar year, how large will this share be? This question will remain a key source of uncertainty with implications for economic triage at all levels of policymaking.
A recent analysis by the Century Foundation suggests that benefit payments have been slow to reach workers, but the situation is likely improving. Data from the U.S. Department of Labor suggests that Louisiana, like most other states, was slow to pay out unemployment benefits through April.8 Louisiana had payed benefits on about 48.8 percent of initial claims received through March and April – close to the national rate (47 percent) and slightly higher than the median rate among states (45.5 percent). A more preliminary analysis of data through May 22 suggests that the payment rate nationally may have increased to 72.7 percent (state breakdowns are unavailable).
Unemployment claims have been high in New Orleans and the metro area when compared with other parts of the state. This difference is partly due to the region’s industry composition. For example, tourism-related industries like Leisure and Hospitality have been hit especially hard.
Parish-level UI claims data from the Louisiana Workforce Commission do not appear to include PUA claims, which account for roughly one-third of total claims statewide. Even without counting these workers, unemployment hit the region hard and fast. In the New Orleans metro, over 110,000 workers either received benefits or filed an initial claim in the week ending June 6.
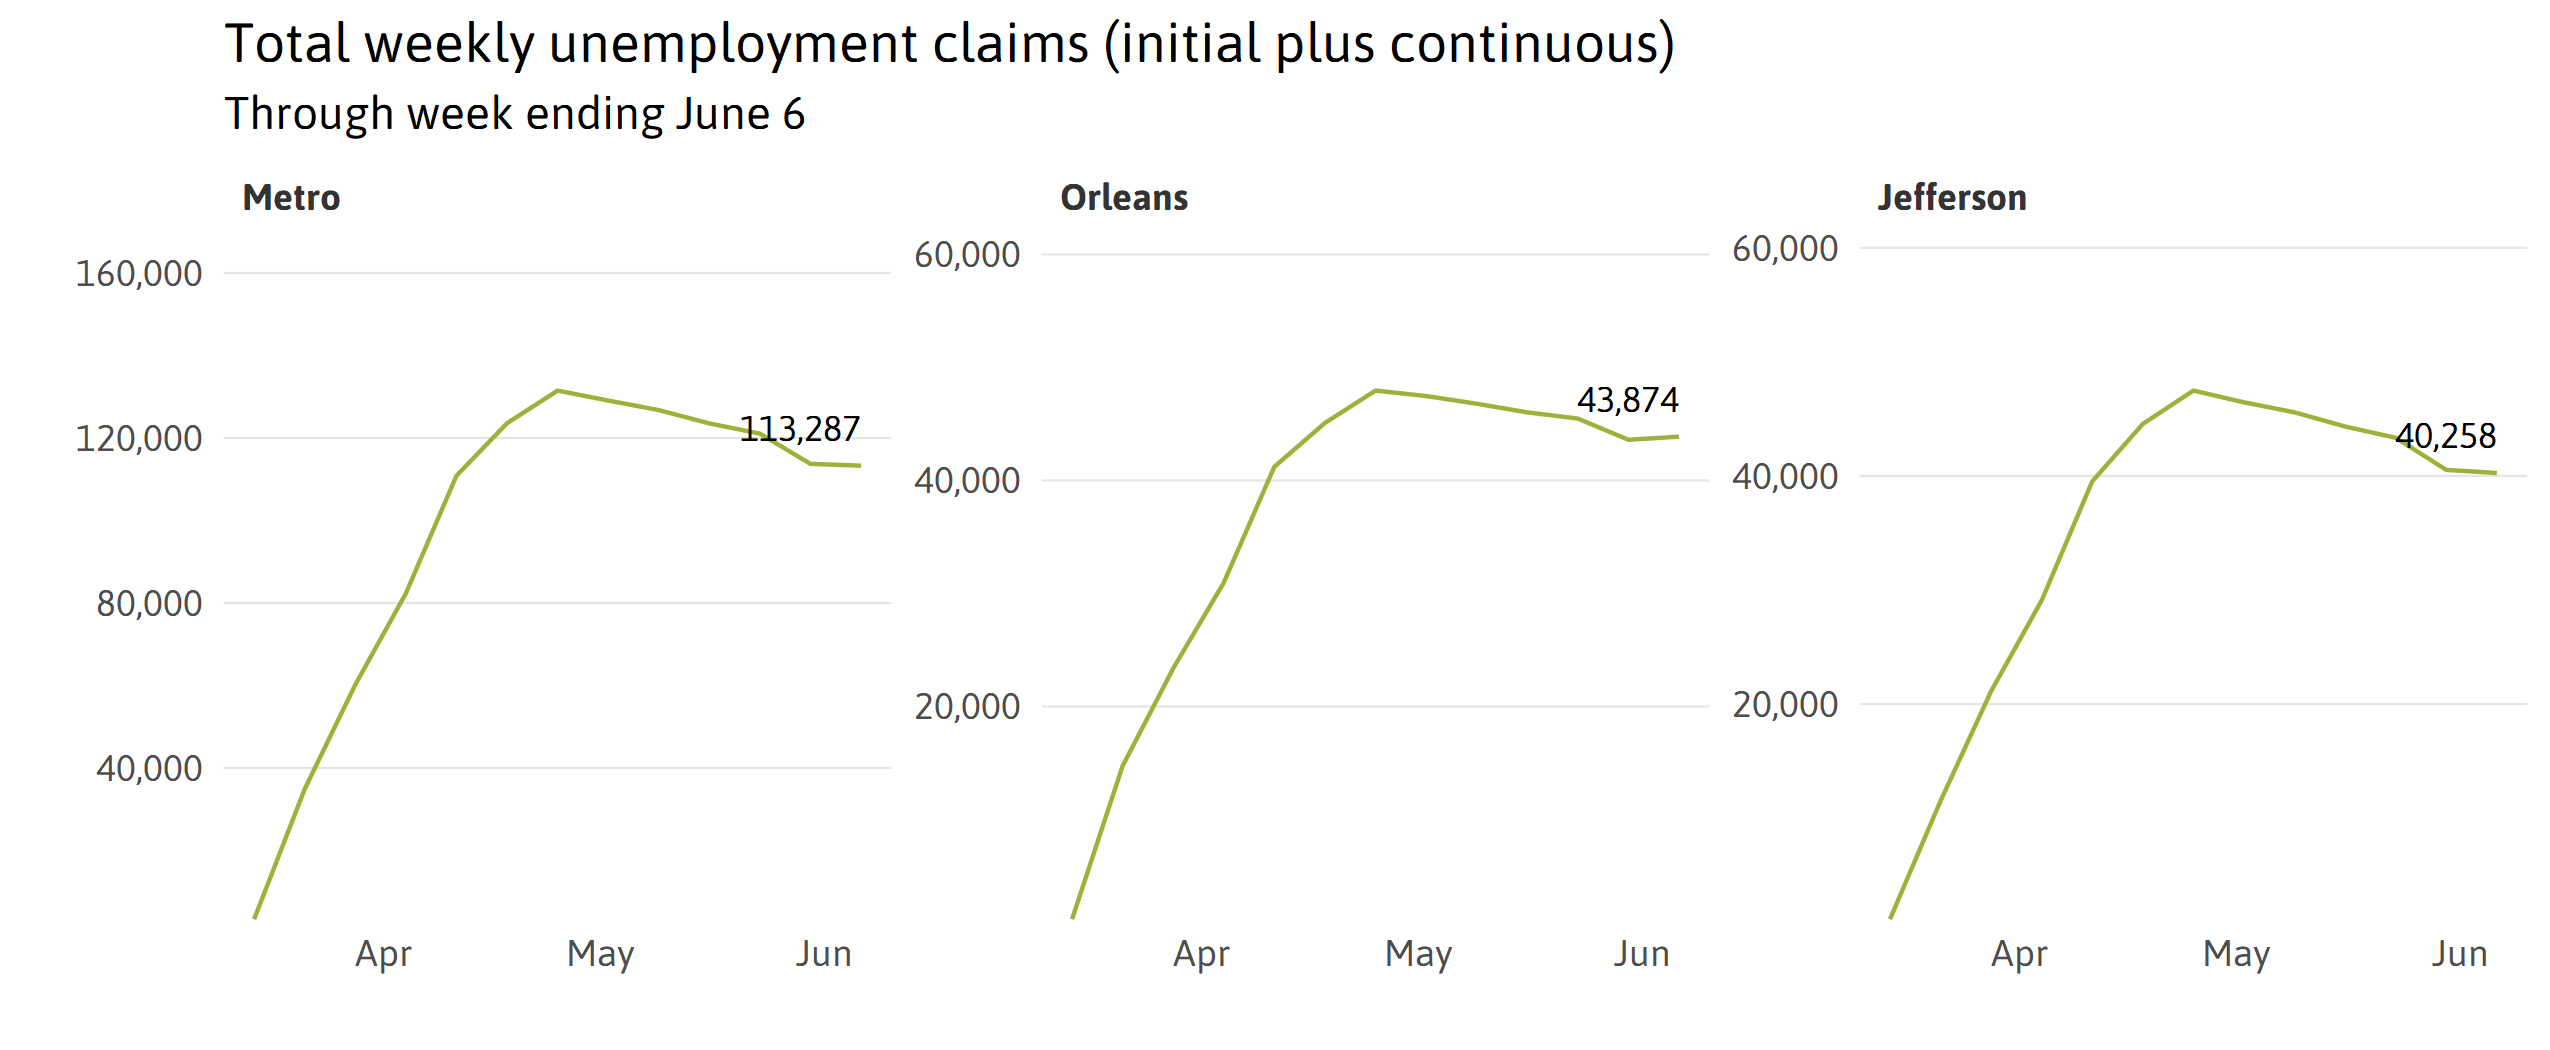
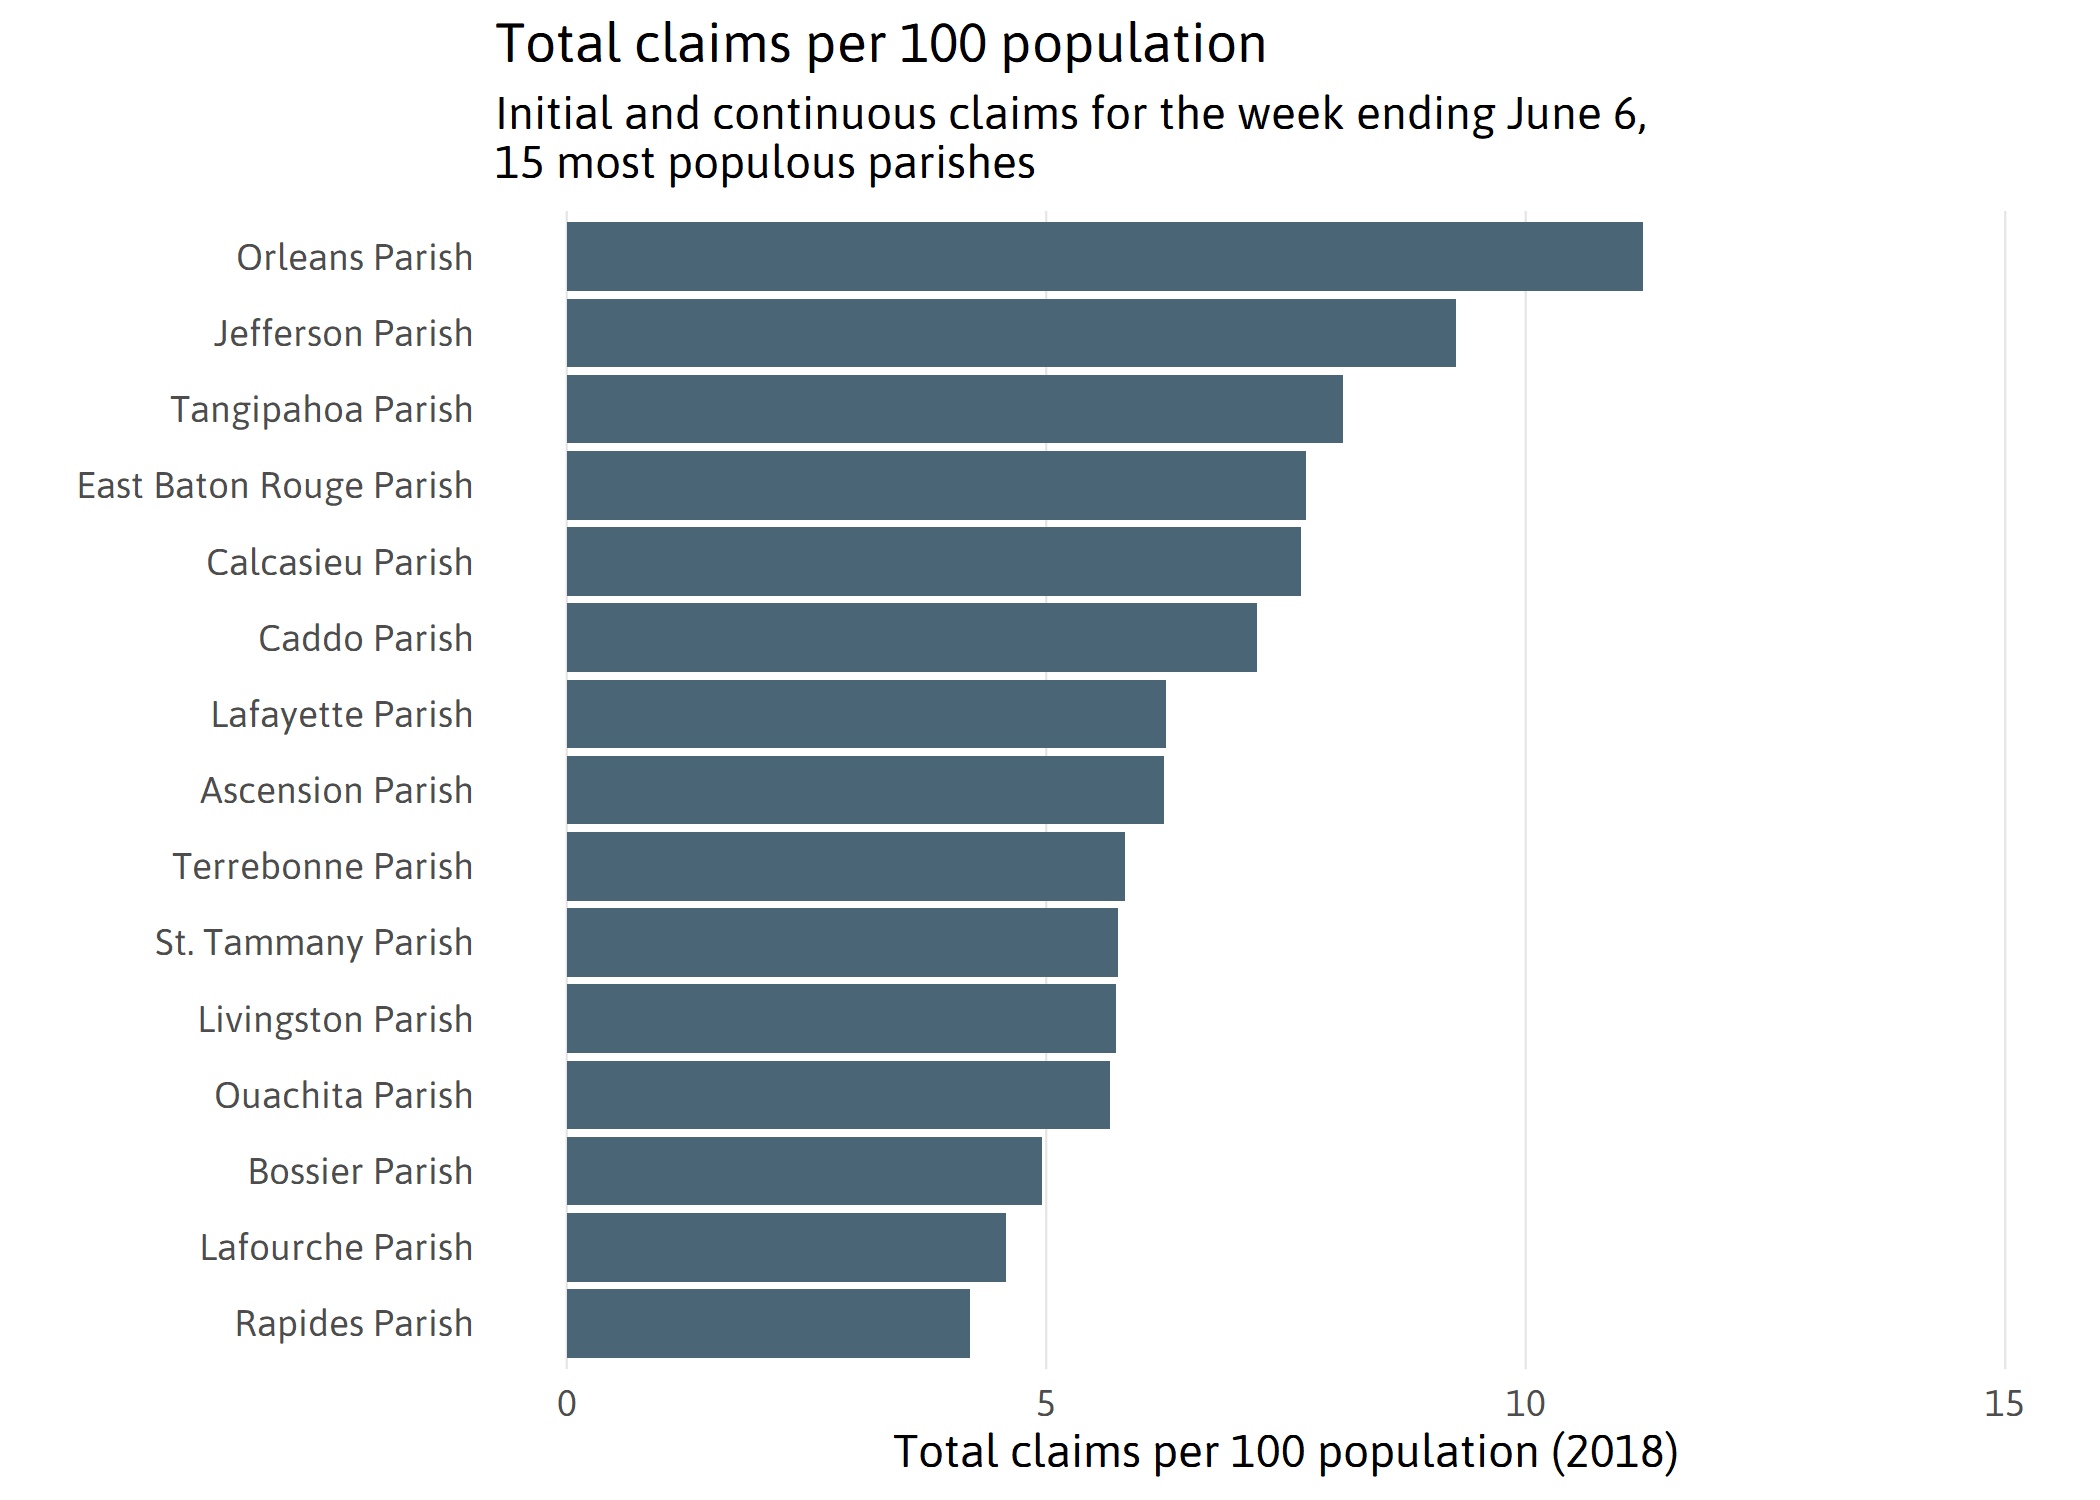
These are staggering totals, but how do they compare with the rest of the state? When adjusting total claims for the week ending in June 6 to reflect differences in population, Orleans Parish and Jefferson Parish rank first and second among the 15 most populous parishes in the state (all roughly 100,000 or higher).9 Likewise, the New Orleans metro has a high rate of total claims per UI-covered employment relative to the statewide total. The New Orleans metro had 29 percent of the state’s jobs before COVID-19 but 35 percent of total claims last week.
Sources:
- Initial and continuous UI claims by parish: Louisiana Workforce Commission
- Population: U.S. Census Bureau

Sources:
- Initial and continuous UI claims by parish: Louisiana Workforce Commission
- 2019 employment: Bureau of Labor Statistics Quarterly Census of Employment and Wages
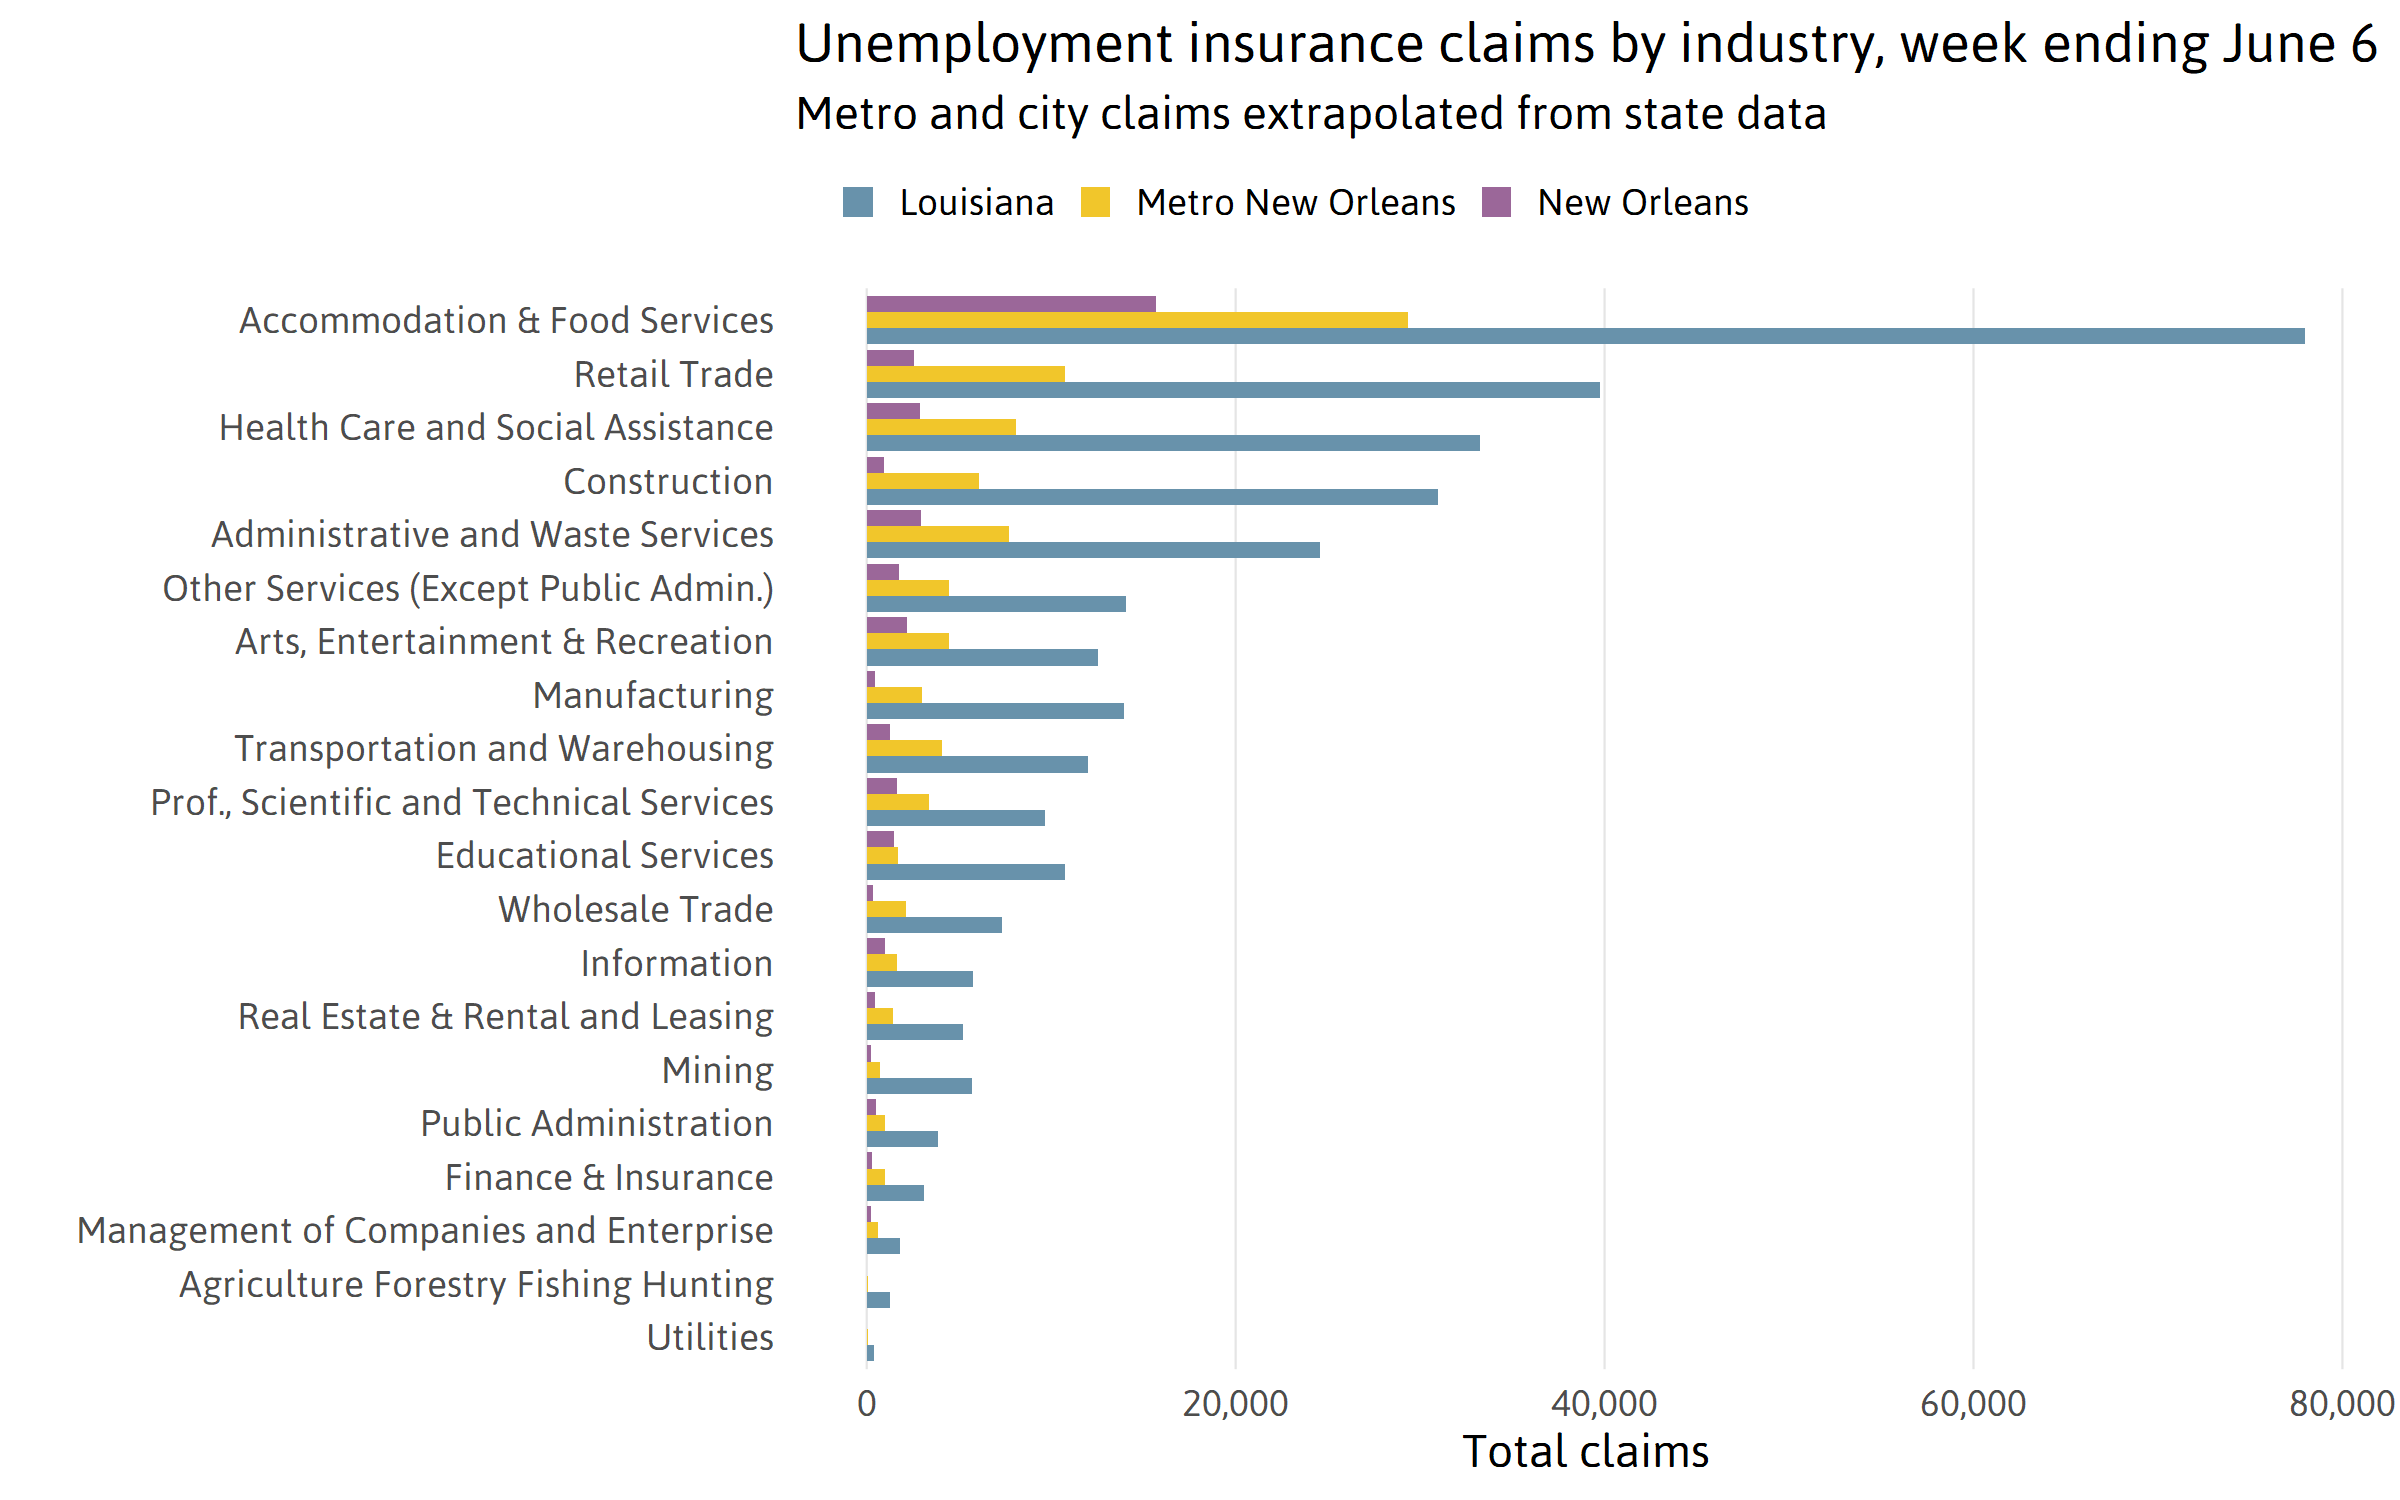
These differences stem in part from the composition of the New Orleans regional economy. As the U.S. economy transitioned into shutdown, early analyses warned of employment loss in hospitality,10 retail, and other customer-facing, “non-essential” industries without the ability to transition to home-based work. The UI data through early June confirms these fears. Accommodation and Food Services accounts for more total claims than any other industry sector in Louisiana.11 Although claims by industry sector are not available by parish, we approximate claims by industry sector for New Orleans and the metro region based on statewide claims by industry and the pre-COVID composition of the local economy to give a rough approximation of the scale of local job loss in each industry sector.12
Sources:
- Statewide initial and continuous UI claims by industry: Louisiana Workforce Commission
- Parish and metro initial and continuous UI claims by industry: The Data Center analysis of statewide claims and September, 2019, employment from Bureau of Labor Statistics Quarterly Census of Employment and Wages
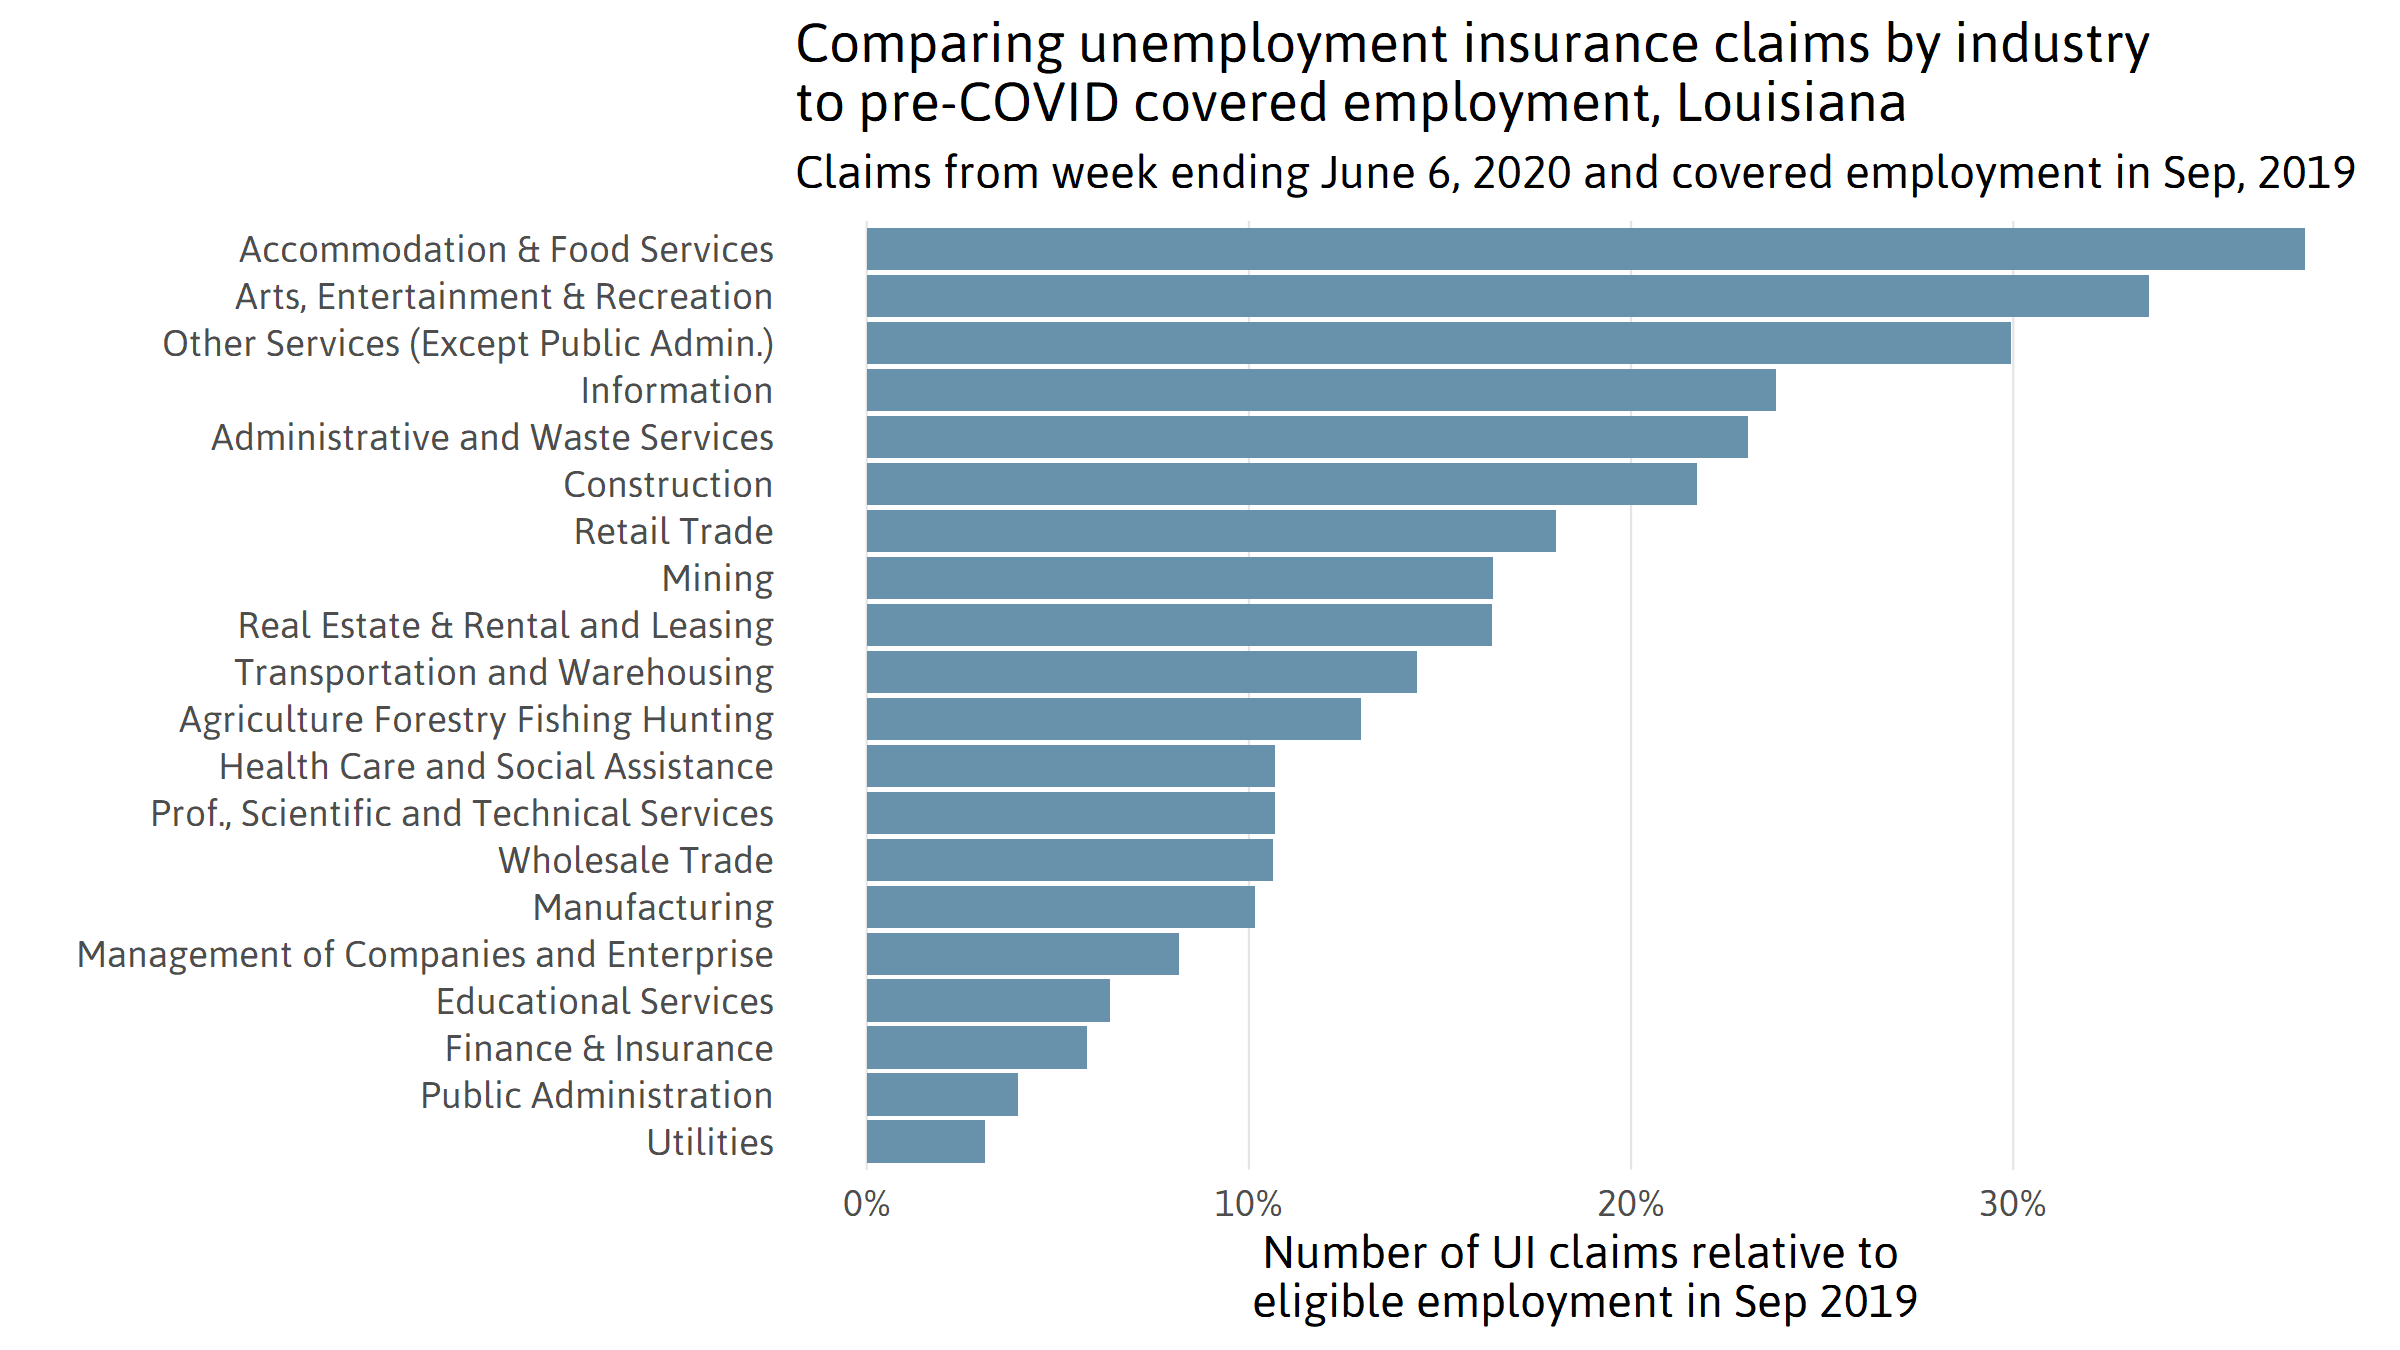
To provide a common reference point for sectors with different employment levels, total claims can be compared with pre-COVID-19 UI-based employment data from 2019.13 For the week ending June 6, the Louisiana Workforce Commission received three or more UI claims (initial and continued combined) for every 10 pre-COVID-19, UI-eligible employees in three sectors: Accommodation and Food Services; Arts, Entertainment, and Recreation; and “Other Services.”14 Even outside of these extremes, nearly every industry sector has seen an exceptional scale of employment disruption.
Source: The Data Center analysis of statewide initial and continuous claims from the Louisiana Workforce Commission and September, 2019, employment from Bureau of Labor Statistics Quarterly Census of Employment and Wages
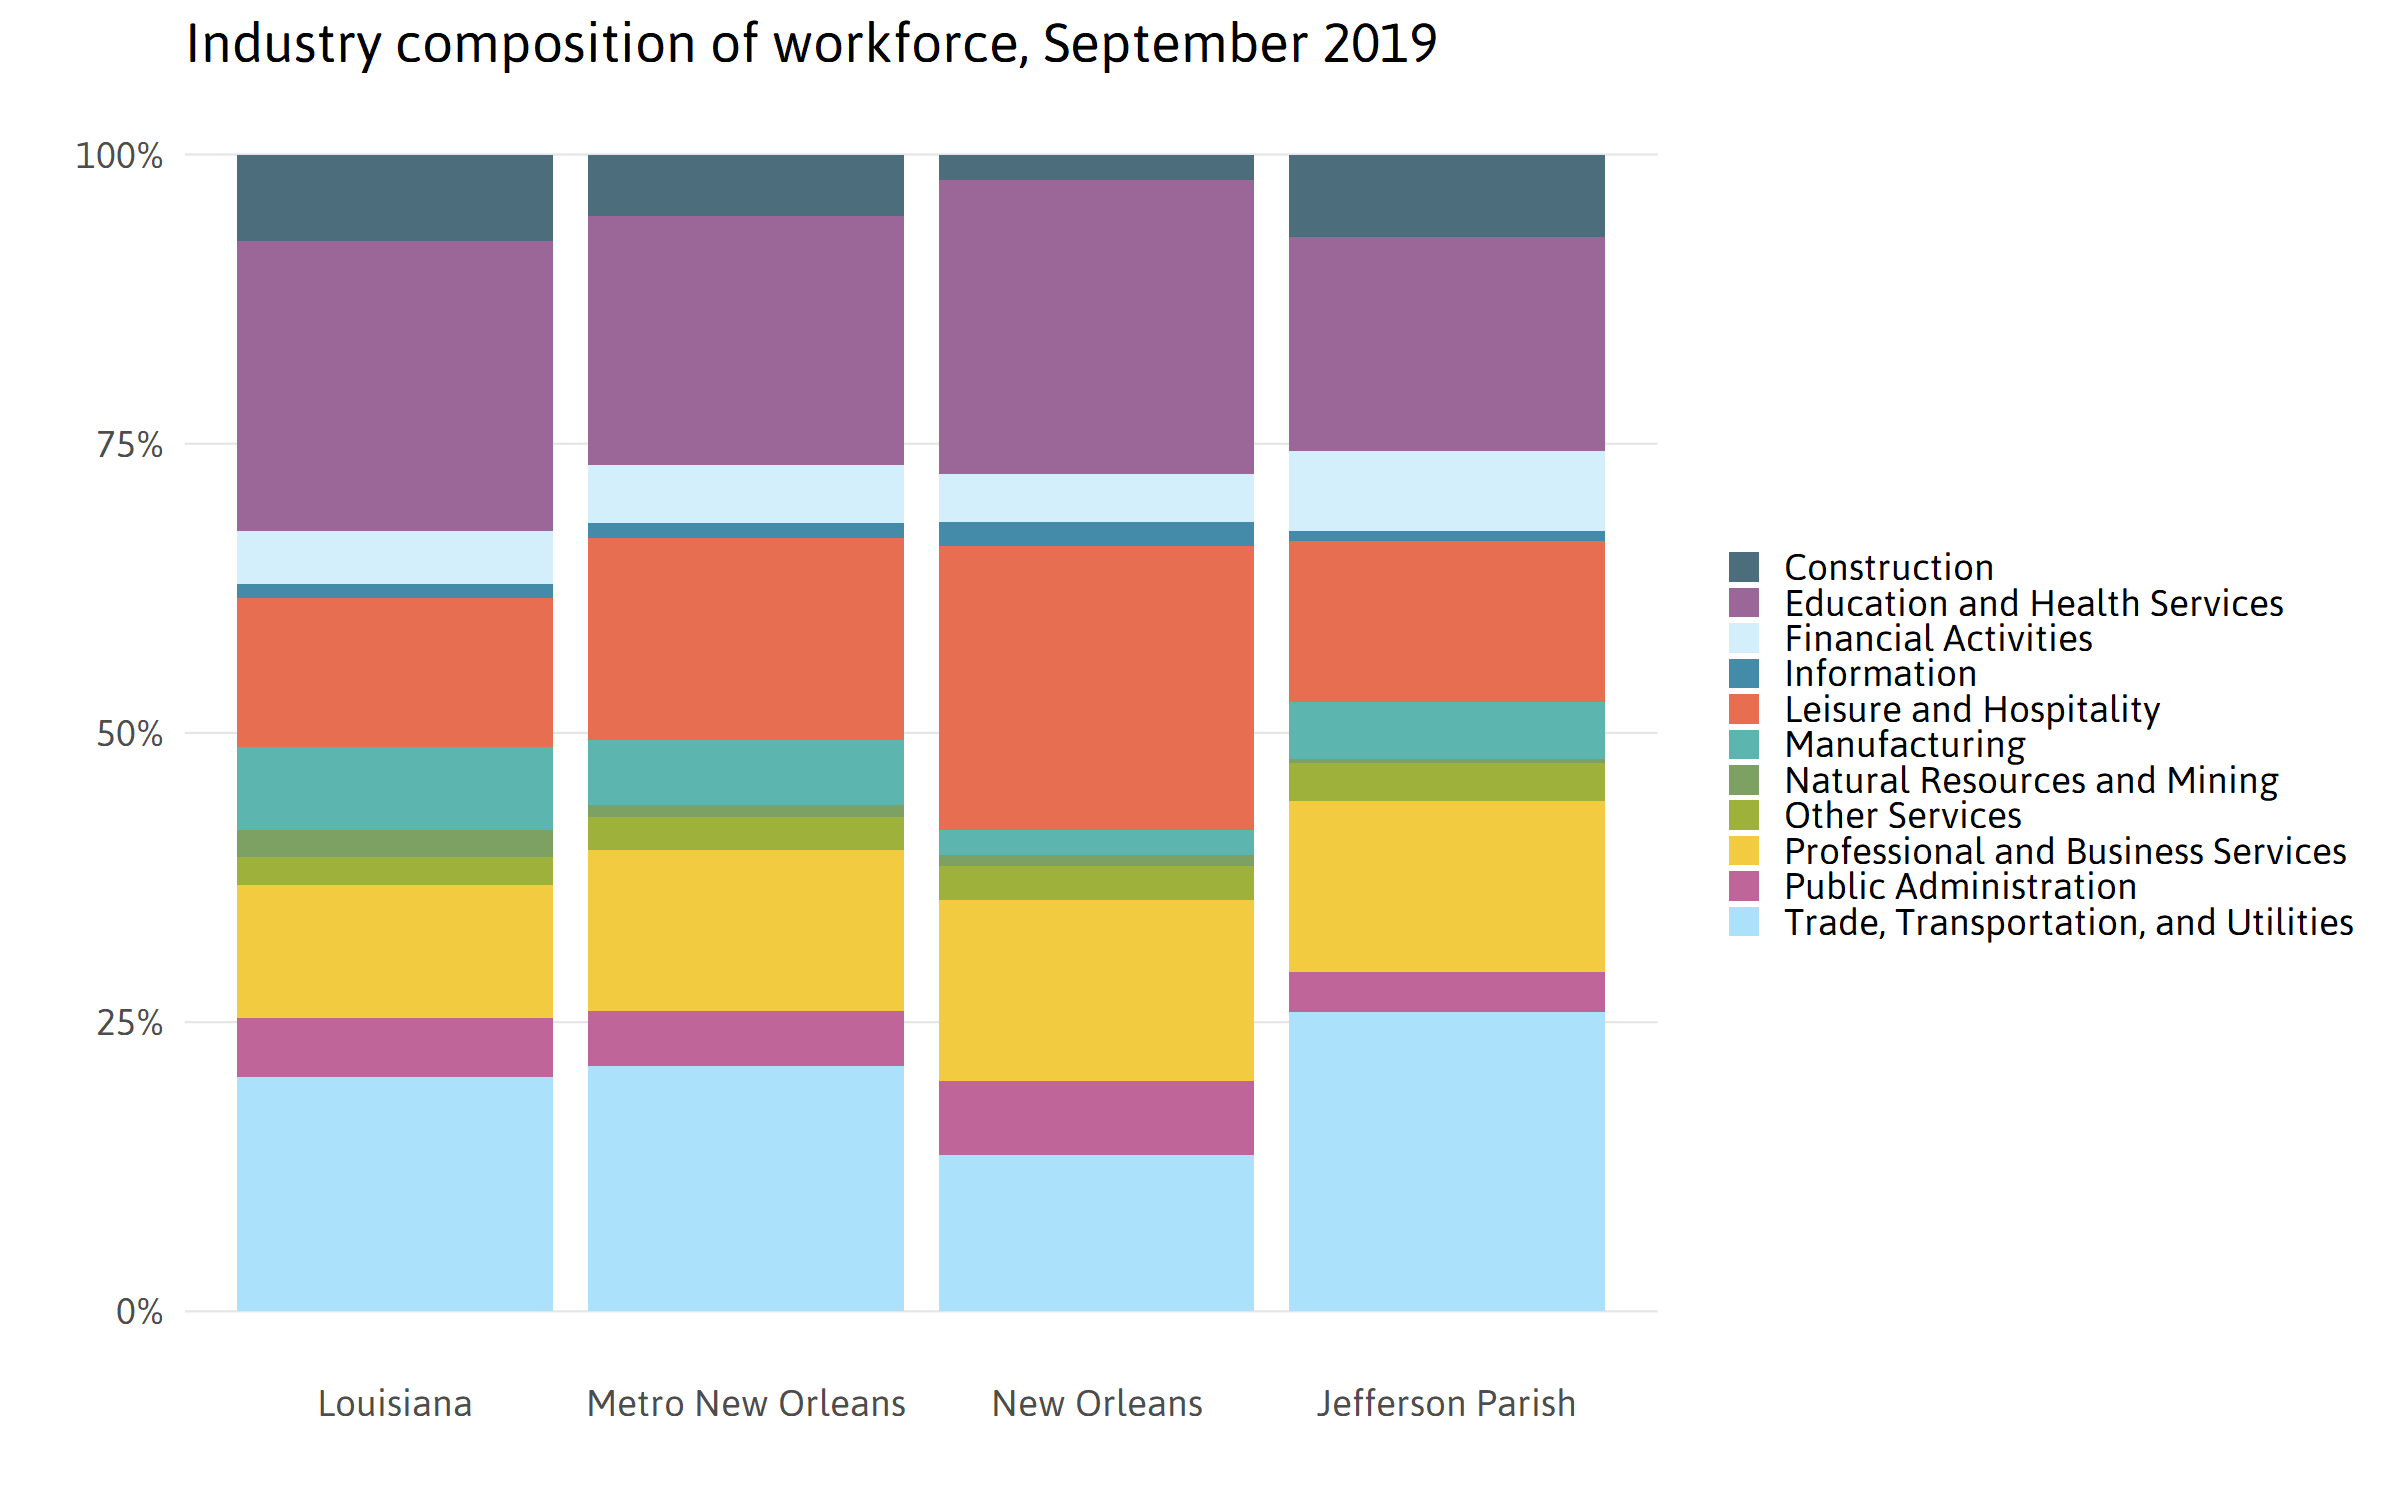
Two of every five of the state’s Leisure and Hospitality jobs (which includes Accommodation and Food Services and Arts, Entertainment, and Recreation) are in the New Orleans metro. Leisure and Hospitality (indicated in orange) accounts for a relatively large share of employment in the New Orleans metro – and Orleans Parish in particular – leaving the local and regional economy exposed to severe, industry-specific job loss. However, industry composition alone does not account for the disproportionate job loss in the New Orleans metro, based on the BLS data presented below, as well as an analysis that compares statewide UI trends and expected local trends based on the industry mix in the metro economy (see appendix).
Source: Bureau of Labor Statistics Quarterly Census of Employment and Wages
Bureau of Labor Statistics data is catching up to COVID-19: Metro job losses through April
Unemployment estimates from April show steep job losses in the New Orleans metro – even steeper than in the rest of the state.
Other sources of local economic data are beginning to catch up with COVID-19. While the numbers are preliminary and data collection itself may have been affected by pandemic,15 the most recent jobs reports from the Bureau of Labor Statistics reflect the employment situation in approximately mid-April 2020.16 According to these preliminary estimates, the April unemployment rate in the New Orleans metro was 18.8 percent. This exceeds the statewide unemployment rate of 14.5 percent, the national rate of 14.4 percent, and the unemployment rate in each of the other 8 metro areas in Louisiana, and the unemployment rate in 88 percent of all metros in the US.17 The New Orleans metro has also experienced the largest increase in unemployment in Louisiana.18
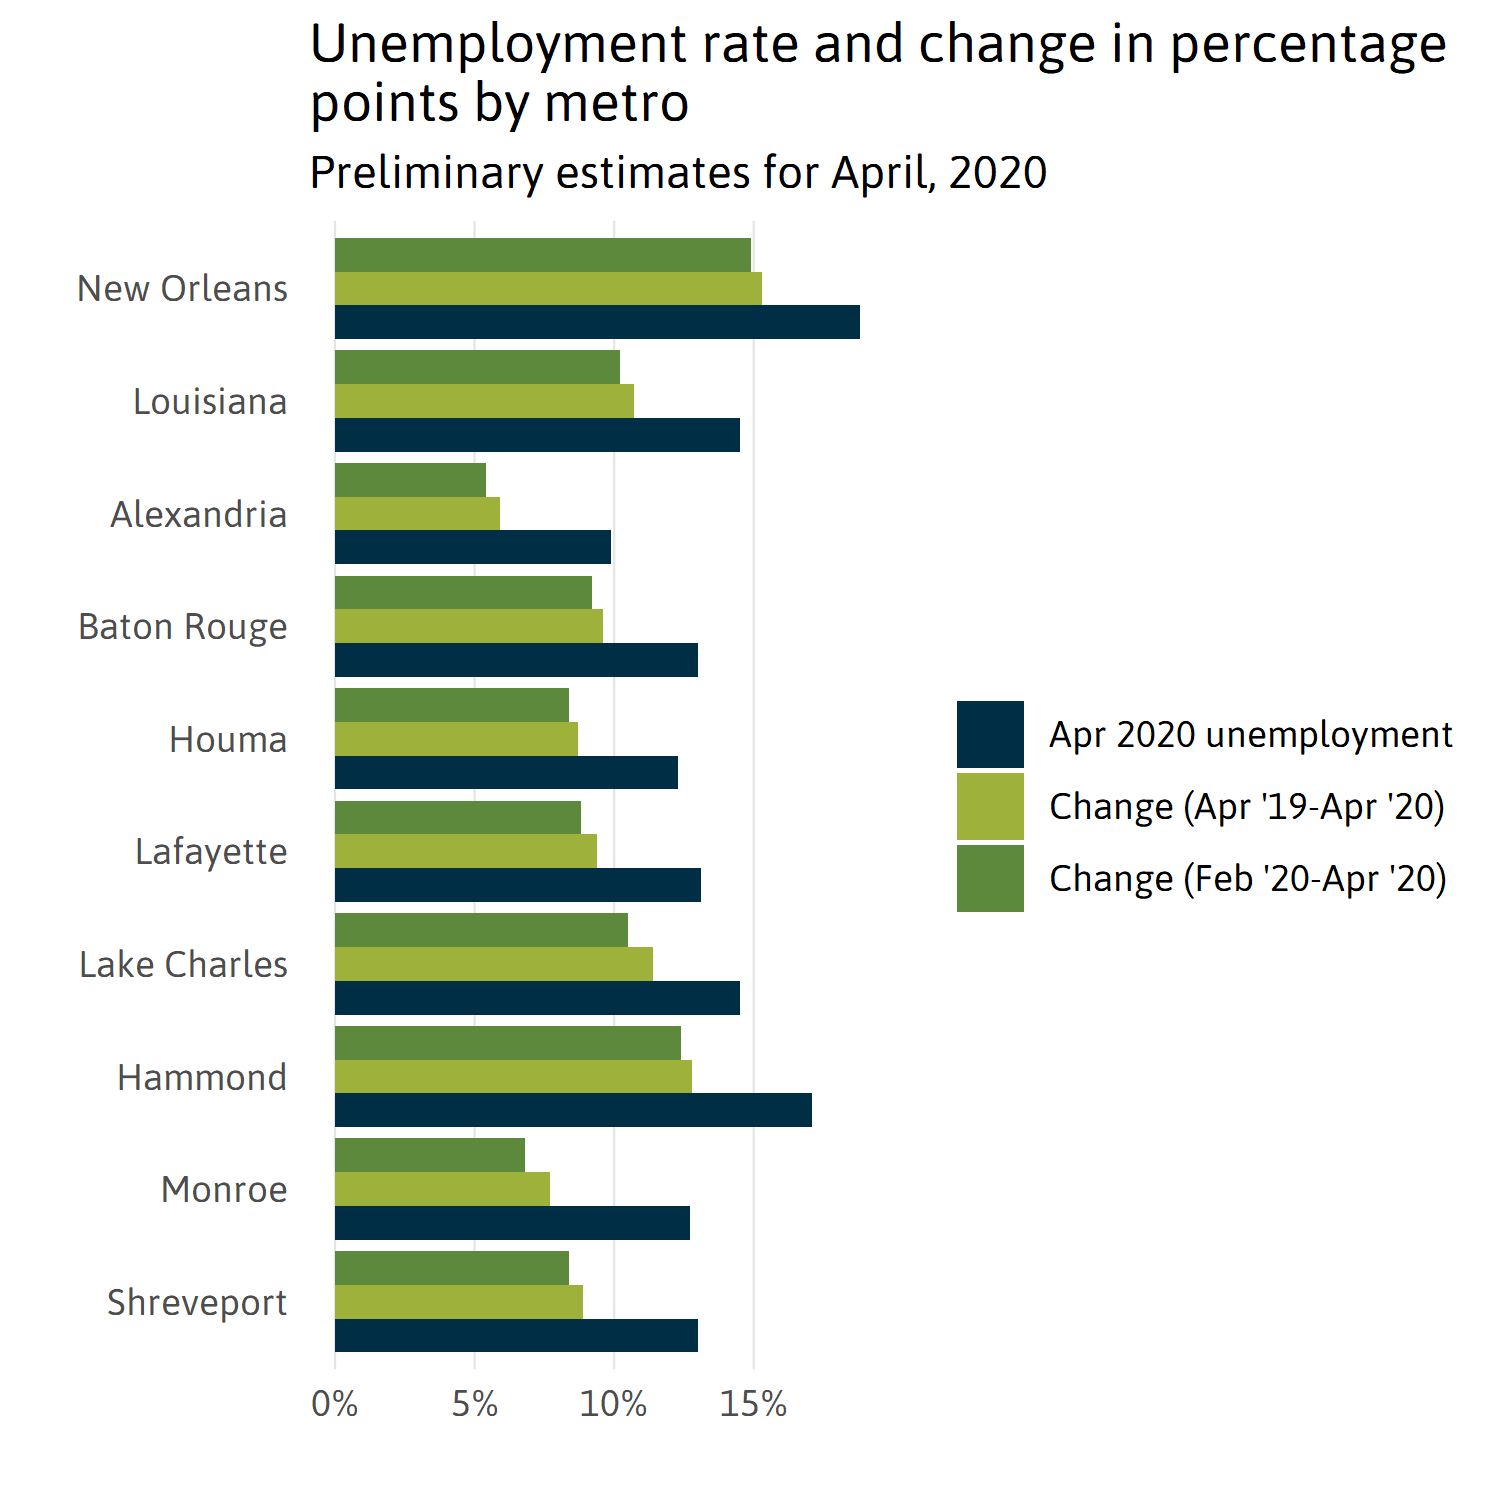
Source: Bureau of Labor Statistics Local Area Unemployment Statistics
Estimates from April show that jobs declined unevenly across industry sectors. Jobs in the leisure and hospitality sector fell by nearly half in the New Orleans metro.
As employment plummeted across the state (see table in appendix), the New Orleans metro experienced an especially sharp decline. Between February and April 2020, total nonfarm employment in Louisiana fell by 261,000, 13 percent of February employment. Nonfarm employment in the New Orleans metro fell by 99,000, 17 percent of February employment, over the same two months. The New Orleans metro accounted for 29 percent of statewide employment in February but 38 percent of employment losses through April. In both relative and absolute terms, the largest losses by far occurred in the Leisure and Hospitality sector, where employment fell by half. Several other industry sectors also suffered double-digit employment losses between February and April.
February and April, 2020, employment in New Orleans metro by industry sector in thousands (source: BLS-SAE, April estimates are preliminary)
| Sector | Feb 2020 | Apr 2020 | Change | Change (%) |
| Total Nonfarm | 586.3 | 487.1 | -99.2 | -16.9 |
| Mining and Logging | 4.4 | 3.9 | -0.5 | -11.4 |
| Construction | 27.2 | 23.5 | -3.7 | -13.6 |
| Manufacturing | 29.7 | 27.9 | -1.8 | -6.1 |
| Trade, Transportation, and Utilities | 111.0 | 95.0 | -16.0 | -14.4 |
| Information | 8.0 | 6.9 | -1.1 | -13.7 |
| Financial Activities | 30.3 | 30.4 | 0.1 | 0.3 |
| Professional and Business Services | 77.3 | 65.6 | -11.7 | -15.1 |
| Education and Health Services | 106.3 | 94.8 | -11.5 | -10.8 |
| Leisure and Hospitality | 93.8 | 47.5 | -46.3 | -49.4 |
| Other Services | 24.5 | 21.0 | -3.5 | -14.3 |
| Government | 73.8 | 70.6 | -3.2 | -4.3 |
Source: Bureau of Labor Statistics Current Employment Statistics (State and Metro Area)
In the New Orleans metro, some services industries experienced particularly large drops in employment between February and April:
- Food services, -35,500 jobs (-54 percent)
- Accommodation, -4,300 jobs (-29 percent)
- Arts, entertainment, and recreation, -6,500 jobs (-50 percent)
- Retail trade, -11,000 jobs (-18 percent)
In total, the New Orleans metro lost about 22,000 more jobs than it would have lost if employment declined at the same rate as the entire state. Of this gap, 10,000 are due to differences in the local industry mix.19
Conclusion
From March through May, unemployment reached extreme levels across the state and the nation, and the weekly UI numbers remain historically high. However, recessions and recoveries tend to have uneven effects on labor markets across geography, industries and occupations, and earnings levels, as well as the race, gender, and age of workers. With a large share of jobs in industries like leisure and hospitality that have experienced the largest job losses, the New Orleans region faces a combination of relatively extensive pandemic job loss and a relatively slow recovery outlook for tourism-based demand. Even when the economy begins to show signs of recovery, tens of thousands of local workers, especially those who were in lower-earning jobs before the pandemic, will struggle to meet basic financial needs through the labor market. Likewise, the recovery of the regional economy may be further stunted by “second-order” effects of depressed spending by households, businesses, and the public sector. While controlling the pandemic remains the foremost concern in managing the regional economy, continual monitoring of economic data can inform anticipations for mitigating a potentially slow, uneven recovery.
Appendix
To examine whether the high job loss in New Orleans is explained solely by industry composition, we compared BLS Current Employment Statistics for the state and metro (see below for state data). We used shift-share analysis to examine employment change between February and April by decomposing local employment change into statewide, industry, and local components. Of the 22,000 excess jobs lost in the New Orleans metro, 10,000 are due to differences in the local industry mix and the remainder are due to other, presumably local effects.
February and April, 2020, Employment in Louisiana by industry sector in thousands (source: BLS-SAE, April estimates are preliminary)
| Sector | Feb 2020 | Apr 2020 | Change | Change (%) |
| Total Nonfarm | 1988.3 | 1727.6 | -260.7 | -13.1 |
| Mining and Logging | 36.2 | 31.4 | -4.8 | -13.3 |
| Construction | 139.4 | 122.0 | -17.4 | -12.5 |
| Manufacturing | 133.9 | 125.0 | -8.9 | -6.6 |
| Trade, Transportation, and Utilities | 374.6 | 336.5 | -38.1 | -10.2 |
| Information | 22.0 | 20.0 | -2.0 | -9.1 |
| Financial Activities | 92.7 | 88.0 | -4.7 | -5.1 |
| Professional and Business Services | 215.8 | 197.0 | -18.8 | -8.7 |
| Education and Health Services | 323.9 | 286.1 | -37.8 | -11.7 |
| Leisure and Hospitality | 240.0 | 130.4 | -109.6 | -45.7 |
| Other Services | 74.5 | 64.6 | -9.9 | -13.3 |
| Government | 335.3 | 326.6 | -8.7 | -2.6 |
Source: Bureau of Labor Statistics Current Employment Statistics (State and Metro Area)
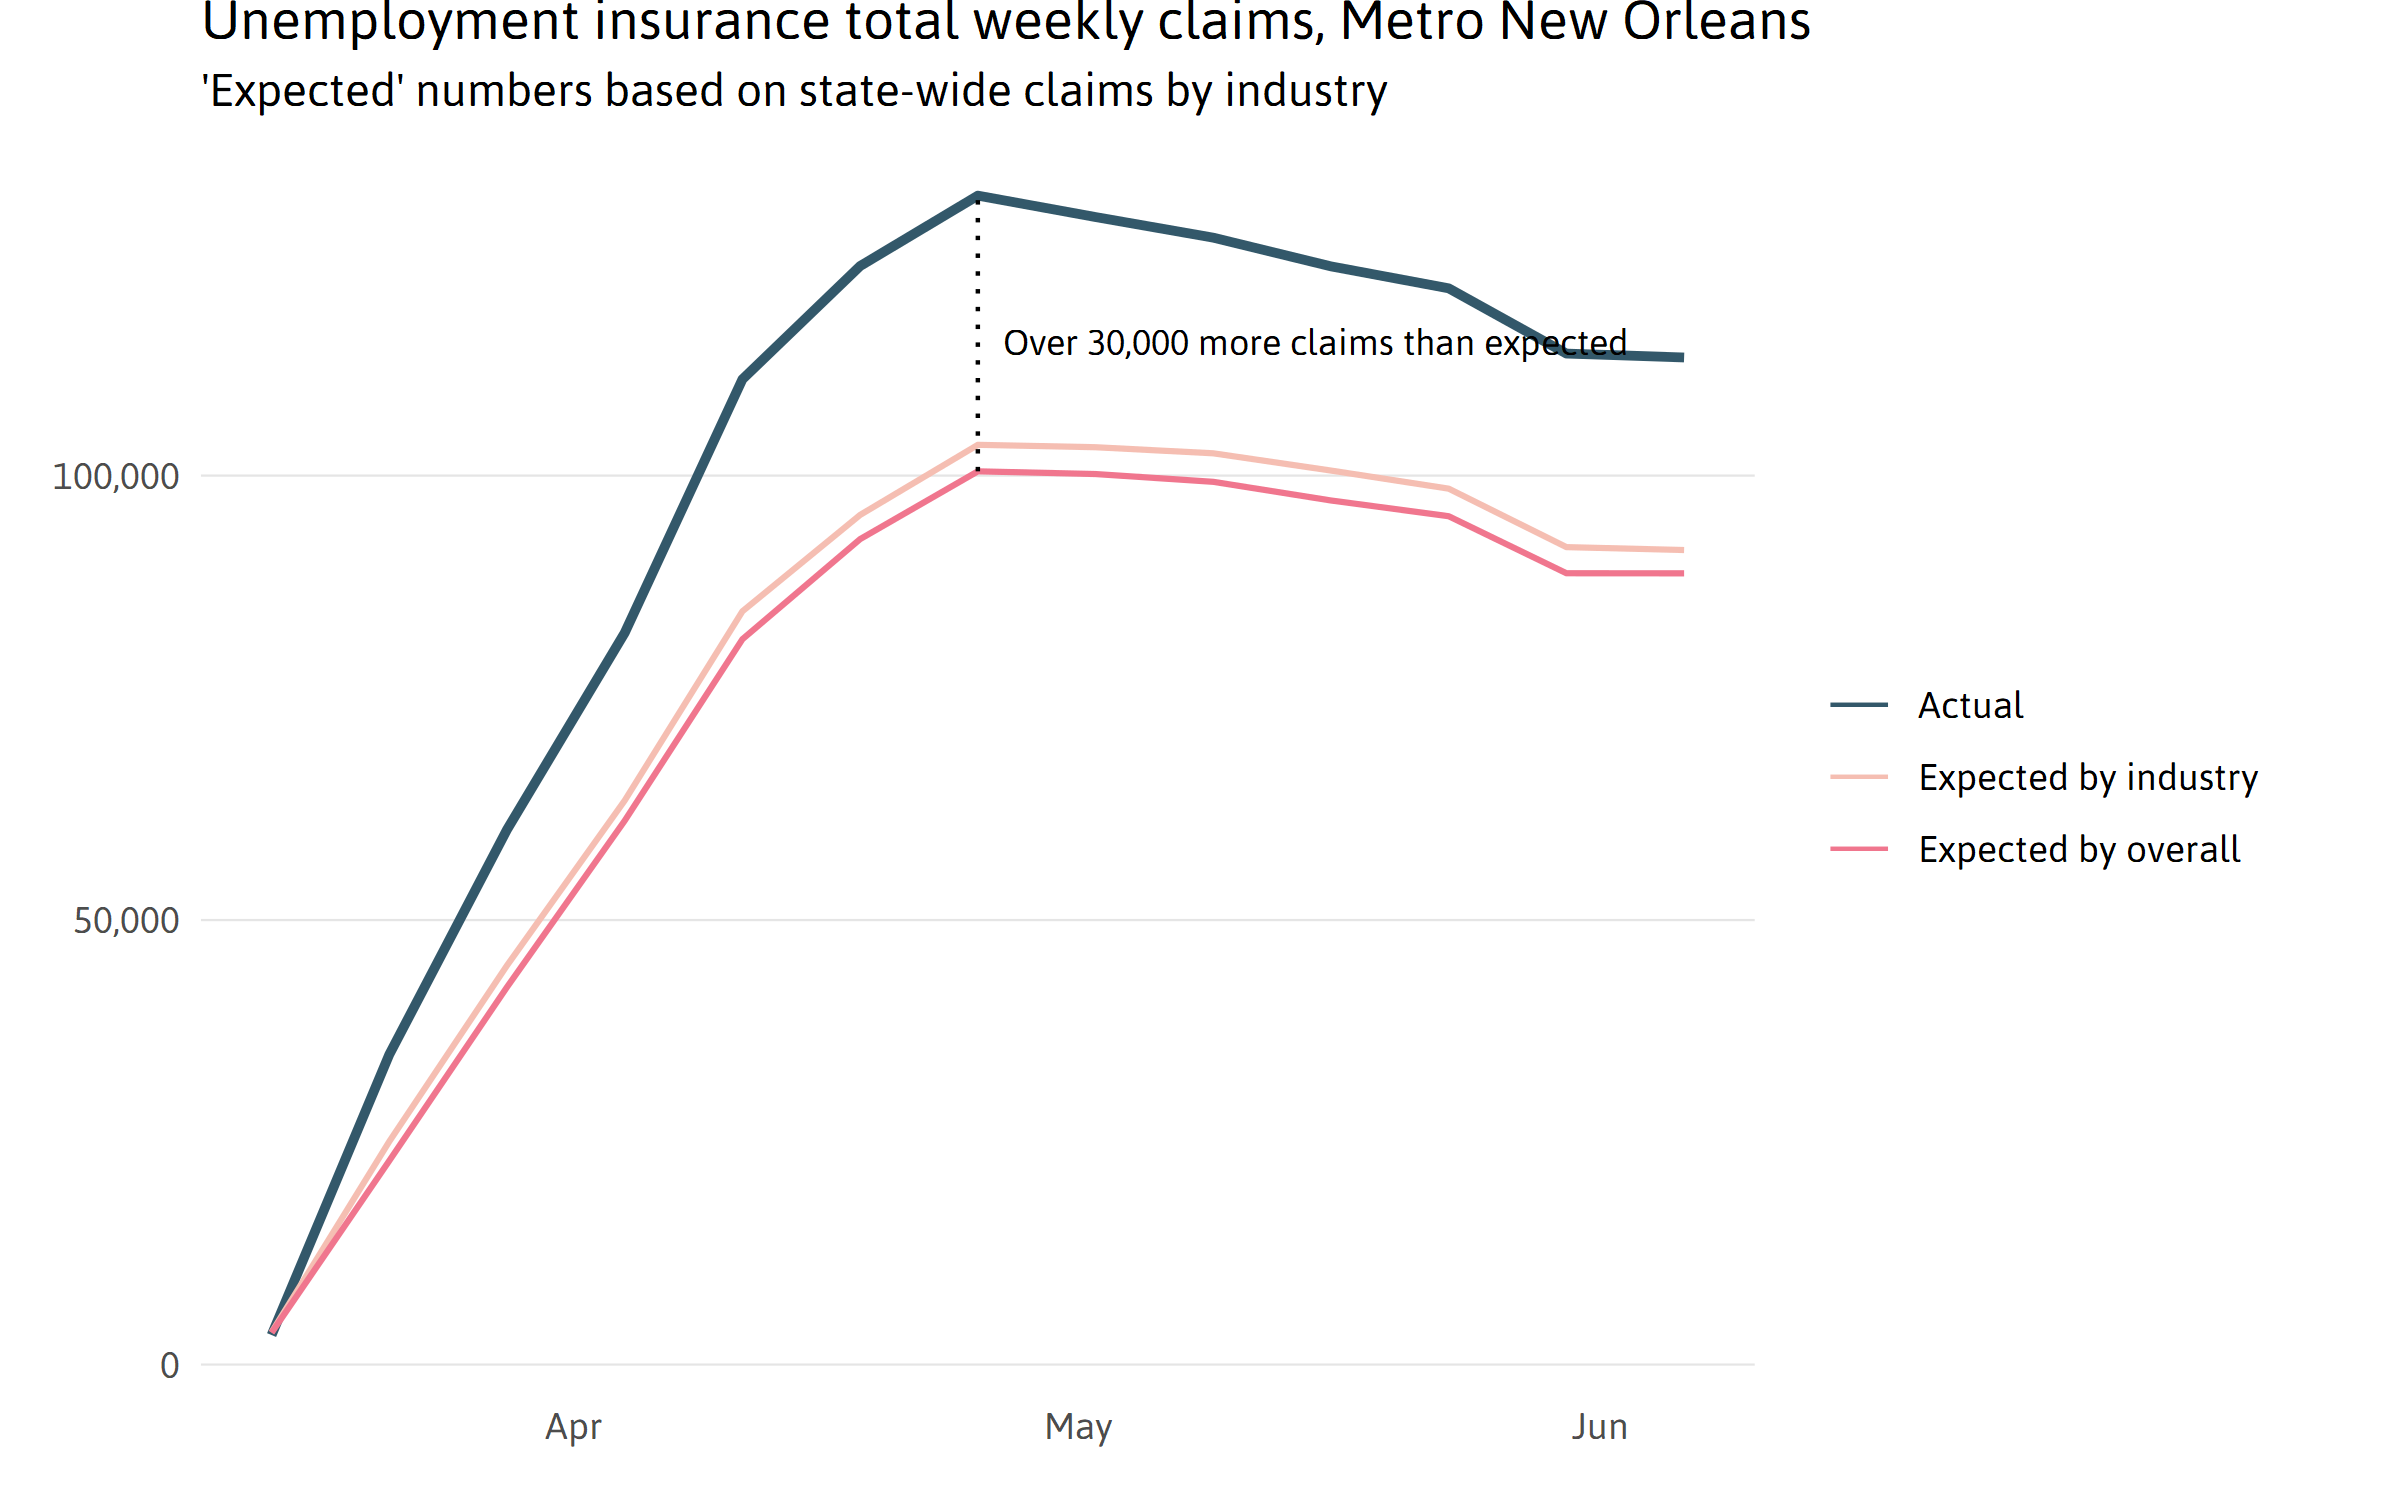
To further examine this question using UI data. We compared the trend in metro-level UI claims with the trend in statewide total claims and claims by industry. We used covered employment in September, 2019, to adjust weekly statewide total claims and claims by industry to match total employment and employment by industry at the metro level. The result is an “expected” trend that naively assumes that, in any given week, UI claims in local industries track in proportion with their counterparts on the state level. The gap between the actual UI trend (blue) and the expected UI trends based on the extrapolating statewide trends onto the metro (pink and red) may be interpreted as claims in excess of what would be expected based purely on differences in the size and industry composition of the state and metro economies.
Sources:
- Statewide initial and continuous UI claims by industry: Louisiana Workforce Commission
- Metro initial and continuous UI claims by industry: The Data Center analysis of statewide claims and September, 2019, employment from Bureau of Labor Statistics Quarterly Census of Employment and Wages
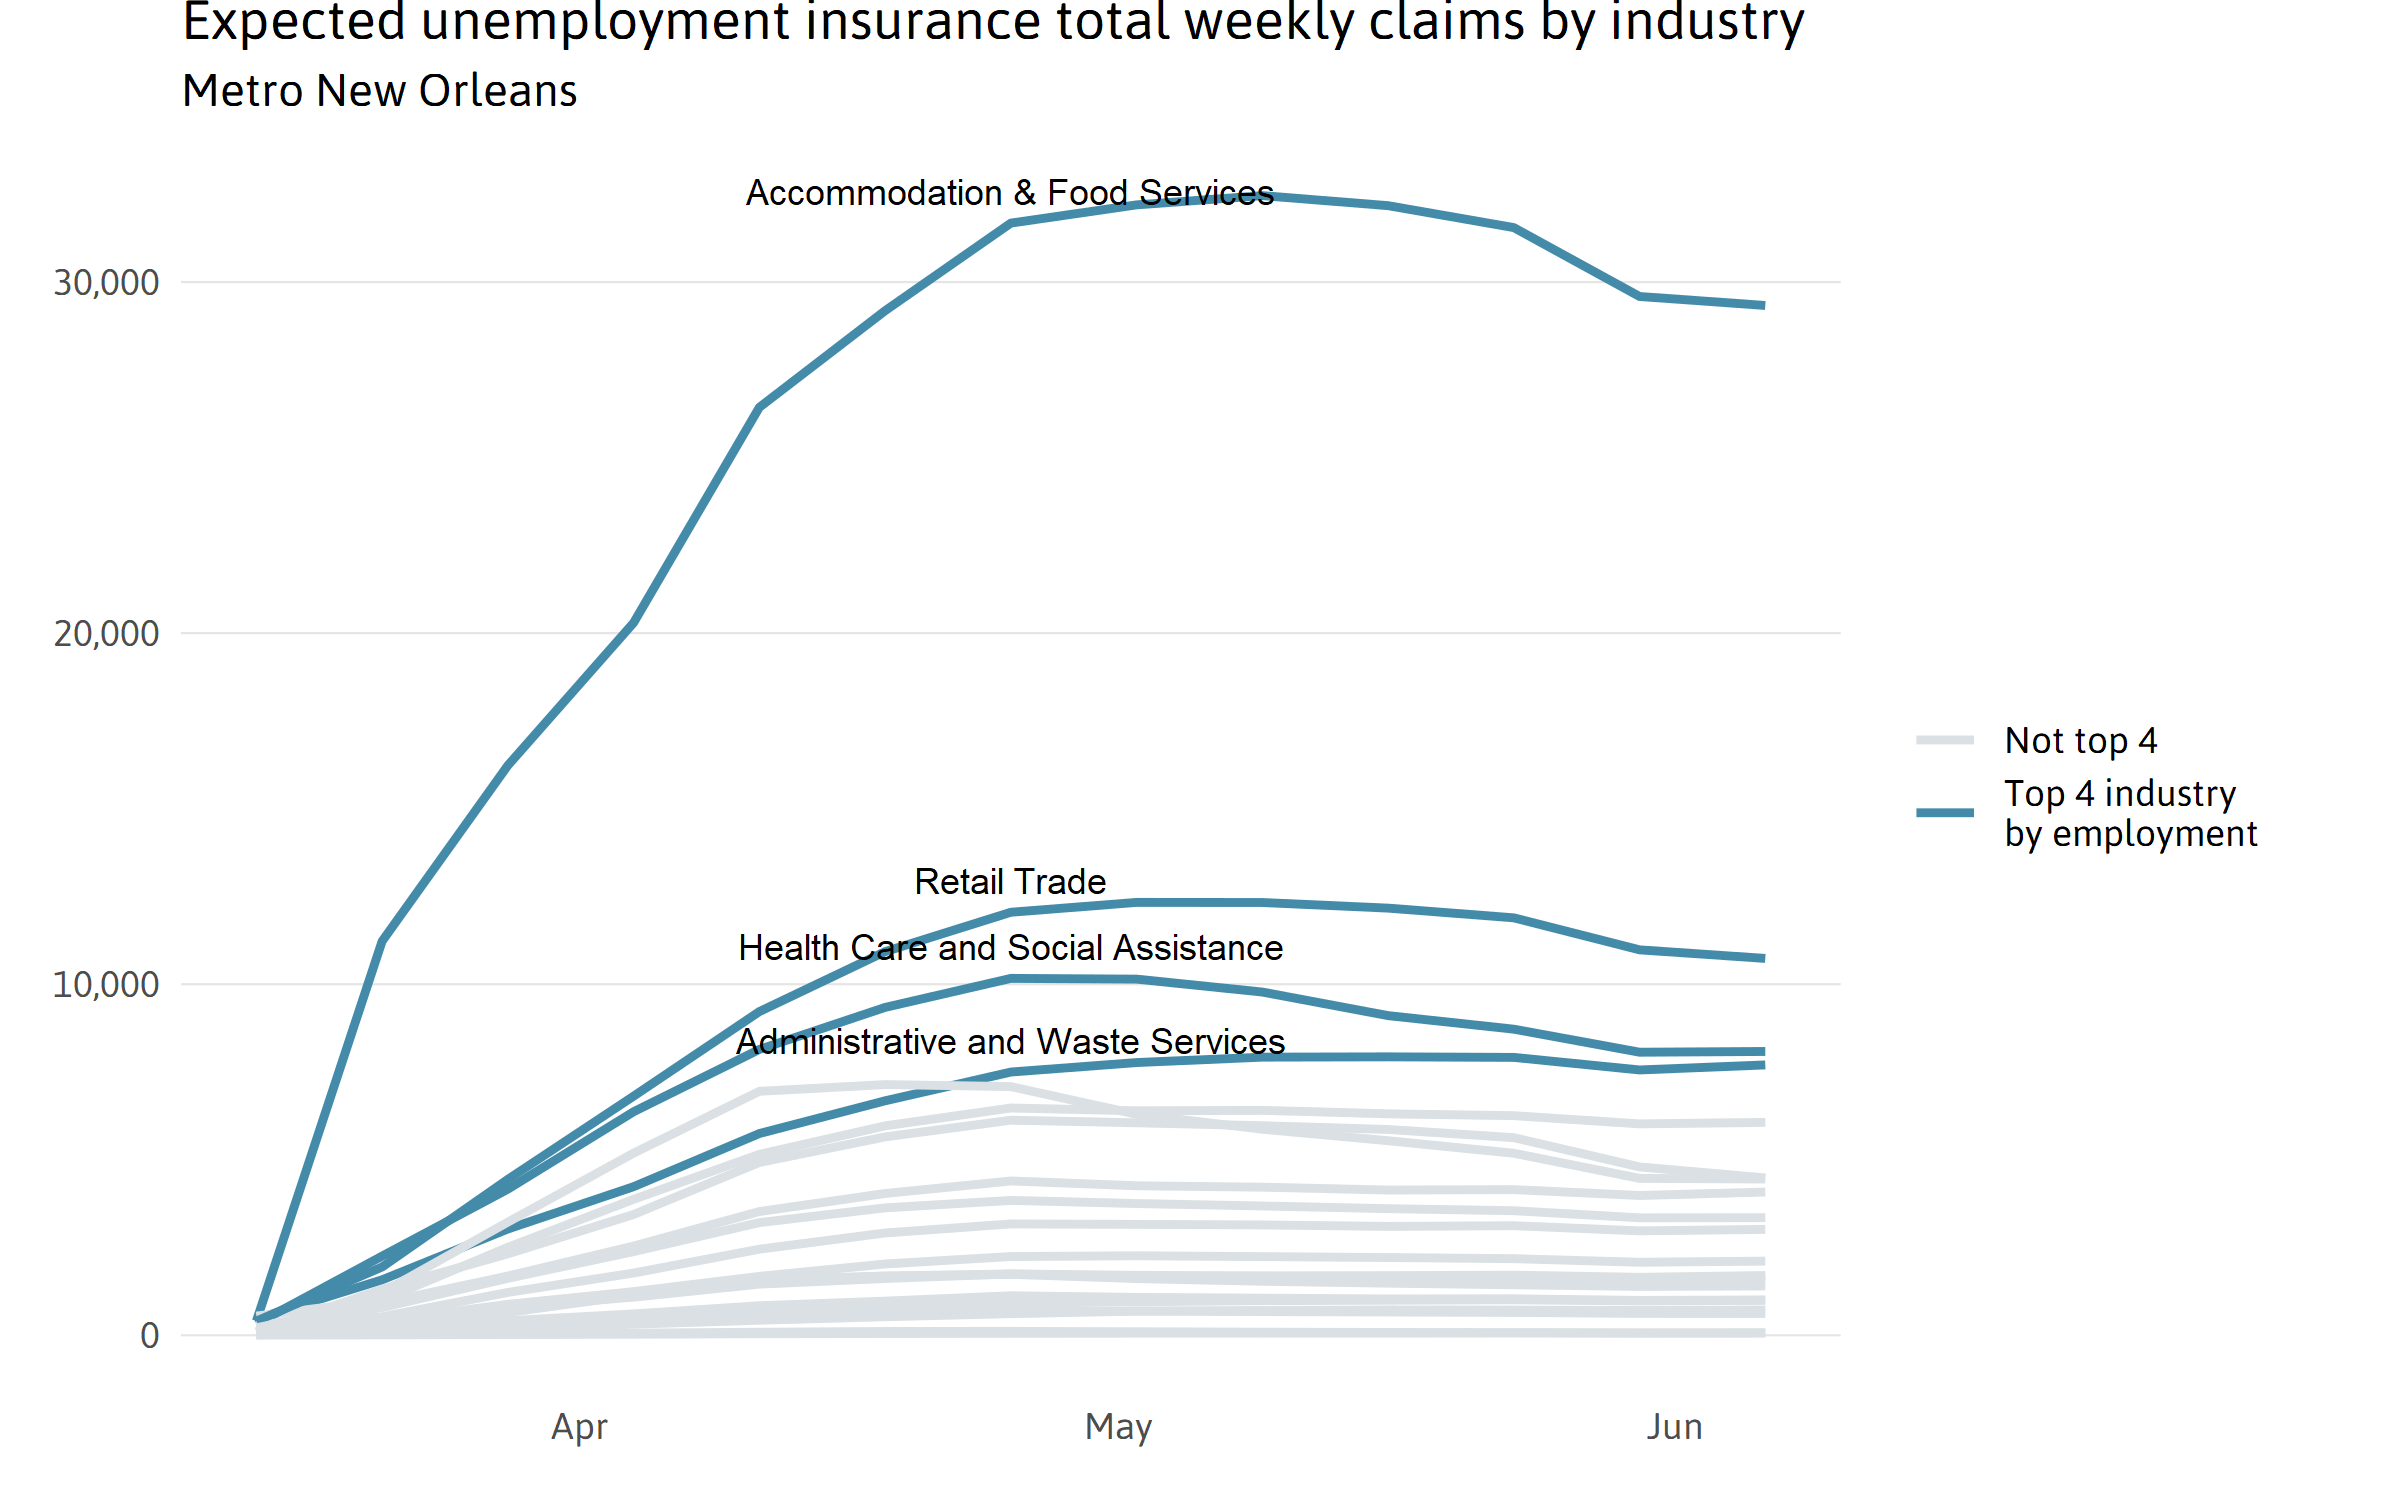
The estimated total claim numbers for individual industries provides some additional context for why the metro area experienced a greater proportion of job loss than the state overall, but ultimately shows that we do not know which industries’ workers had disproportionately high need for UI benefits in the New Orleans metro. The four industries employing the most people in the metro also saw high rates of UI claims statewide. High employment in industries that lost a high proportion of jobs contributed to steep numbers in local UI claims. Even still, far more claims were filed than this analysis indicates we could have expected based on the metro’s industry composition. The actual number of UI claims by industry at the metro level is not available.
Sources:
- Statewide initial and continuous UI claims by industry: Louisiana Workforce Commission
- Metro initial and continuous UI claims by industry: The Data Center analysis of statewide claims and September, 2019, employment from Bureau of Labor Statistics Quarterly Census of Employment and Wages
Sources and Footnotes
1 Monthly BLS data is initially released as a preliminary estimate that is subject to revision. The unusual scale of current labor market volatility and COVID-19’s effect on the data collection process may make the April estimates more unreliable than usual. See the BLS’s frequently asked questions for more details.
2 Unemployment insurance data is straightforward tally of records collected while state agencies administer their unemployment systems. Because its purpose is administrative, it is not a perfect measure of joblessness and may be affected by administrative factors, like implementing provisions of the CARES Act and challenges stemming from an extremely high volume of claims. In contrast, the BLS monthly employment data relies on a combination of national household and establishment surveys with a reference period approximately corresponding with the 12th of the month, and additional sources – including unemployment claims – are employed to construct reliable local estimates. Typically, these surveys consider people who are jobless but actively looking for work to be “unemployed,” but unique challenges of the pandemic and social distancing led BLS to alter some of their approach to classification.
3 US Senate Joint Economic Committee, “Getting an Accurate Picture of New Unemployment Claims,” May 20, 2020, https://www.jec.senate.gov/public/_cache/files/a9c6c816-5ffd-43fd-8bb4-e0461ca19a91/jec-issue-brief-on-upcoming-ui-claims.pdf?mod=article_inline#:~:text=This%20is%20a%20result%20both,program%20recently%20passed%20by%20Congress.; Shierholz, Heidi, “More than one in five workers are either receiving unemployment benefits or waiting for approval,” Economic Policy Institute, May 28, 2020. https://www.epi.org/blog/more-than-one-in-five-workers-are-either-receiving-unemployment-benefits-or-waiting-for-approval-congress-must-do-much-much-more/
4 For example, estimates of self-employment in the New Orleans metro from EMSI suggest that self-employment in Performing Arts, Spectator Sports, and Related Industries is 2,314, which is 56 percent of wage and salary employment in the same industry group. Total self-employment in the entire metro economy is only 9 percent of total wage and salary employment.
5 Continued claims correspond with the weeks ending in May 16 for regular state claims and May 9 for PUA claims, and initial claims for both programs reflect totals for the same weeks through May 23. Since the four numbers reported have different lags, each of the four categories reflects weeks ending in the following days: Regular state continued claims (May 16), Regular state initial claims (May 16, 23), PUA continued claims (May 9), PUA initial claims (May 9, 16, 23). Due to the likely bias introduced by seasonal adjustment in the context of extraordinary current trends, we follow others in reporting non-seasonally adjusted numbers.
6 At present, the reasons why this figure differs from cumulative initial UI claims remain unclear. Most media reports have reported a cumulative total of initial claims since the start of pandemic-related shutdowns in mid-March. Louisiana’s cumulative initial claims stand at over 670,000 between March 14 and June 6. The discrepancy could be due to the more recent reporting of PUA claims, claims denials, unemployed UI recipients returning to work, or administrative issues and double counting. An additional caveat is that the PUA figures should be interpreted as preliminary. Louisiana has reported PUA claims to the Department of Labor since the May 14 release, but 14 other states and the District of Columbia have not yet done so. As with many other states, PUA initial claims reported by Louisiana have fluctuated dramatically in ways that likely reflect administrative challenges with activating a new program more than fluctuations in “real” claims. Specifically, in the four weeks of PUA initial claims available for Louisiana, initial claims have ranged between 17,000 and 25,000 for three of the four weeks. However, for the week ending May 16, only 3,000 claims were reported, far lower than the weeks immediately preceding and following.
7 U.S. Department of Labor Employment and Training Administration. (2019). “Chapter 3 Monetary Entitlement” in Comparison of State Unemployment Laws 2019. https://oui.doleta.gov/unemploy/comparison/2010-2019/comparison2019.asp
8 Andrew Stettner and Amanda Novello, “Unemployment Payouts Accelerated during April and May—but Are Still Too Slow,” The Century Foundation. https://tcf.org/content/commentary/unemployment-payouts-accelerated-april-may-still-slow
9 Comparing combined initial and continued claims is mimics a measure developed for the Opportunity Insights Economic Tracker. See Chetty et al. (2020). Real-Time Economics: A New Platform to Track the Impacts of COVID-19 on People, Businesses, and Communities Using Private Sector Data. https://opportunityinsights.org/wp-content/uploads/2020/05/tracker_paper.pdf
10 Leisure and Hospitality includes Food Services and Drinking Places; Accommodation; and Arts, Entertainment, and Recreation.
11 Pandemic job losses also hit the sector very fast. Weekly initial claims for Leisure and Hospitality workers peaked the week ending March 23, two weeks earlier than the peak in most other sectors.
12 This assumes that UI claims are distributed evenly across the state according to where the jobs in each industry sector are located. Note that these are not direct measures but approximations based on a mix of state and local data.
13 This data comes from the BLS Quarterly Census of Employment and Wages, which includes all workers covered by state unemployment insurance laws, as well as some federal workers. This data covers 95 percent of jobs nationally and provides the most appropriate reference point for UI initial claims.
14 According to the Bureau of Labor Statistics, “Other Services” includes businesses primarily engaged in a wide range of activities: “equipment and machinery repairing, promoting or administering religious activities, grantmaking, advocacy, and providing drycleaning and laundry services, personal care services, death care services, pet care services, photofinishing services, temporary parking services, and dating services.” See Bureau of Labor Statistics. (2020). “Industries at a Glance: Other Services (except Public Administration): NAICS 81.”
15 See the series of reports on the pandemic impacts on BLS’s data collection. https://www.bls.gov/bls/bls-covid-19-questions-and-answers.htm
16 The data reported here is analogous to the BLS Employment Situation releases, the “jobs report” for the entire US economy, though the local data lags behind the national data by one month. To the surprise of many economists, national estimates suggested that the US added 2.5 million jobs between mid-April and mid-May, mostly in Food Services and Drinking Places. The unemployment rate fell from 14.7 to 13.3 percent, although the BLS also reported that the May number is likely 3.1 percent higher as unemployed survey respondents were likely mistakenly classified as employed.
17 Like the local numbers, the state and federal unemployment rates are not seasonally adjusted. Comparisons with other metros nationally are based on data downloaded from GEOFRED on June 9, 2020 (http://geof.red/m/kNthttp://geof.red/m/kNt).
18 Since unemployment rates reflect the results of a household survey conducted in the middle of the month, it is likely that April estimates are slightly lower than the “true” rate of unemployment at the end of April.
19 This was calculated by comparing state and local jobs BLS employment estimates for February and April using a shift-share decomposition.
