Chapter Two
The Origins and Persistence of Neighborhood Inequality
down arrow
Scroll Down

Chapter 1 explored how racial disparities, neighborhood conditions, and differences in mortality contribute to stunning gaps in life expectancies across the New Orleans metro. But how did such place-based inequalities come to exist in the first place? This chapter looks to the past, using historical data on changes in neighborhood racial composition and socioeconomic status to explore the evolution of neighborhood inequality over time. Chapter 3 concludes with a look to the future, returning to the implications of neighborhood life expectancy data for efforts to reduce racial and place-based inequality.

The emergence and persistence of place-based inequality may not be immediately apparent on maps that provide snapshots of data, like life expectancy. This chapter shows how the evolution and durability of place-based inequality relates to stalled progress on racial equity, as documented across a broader range of systems-level measures in The Data Center’s 2018 Prosperity Index and as implied by the disparities covered in the previous chapter.

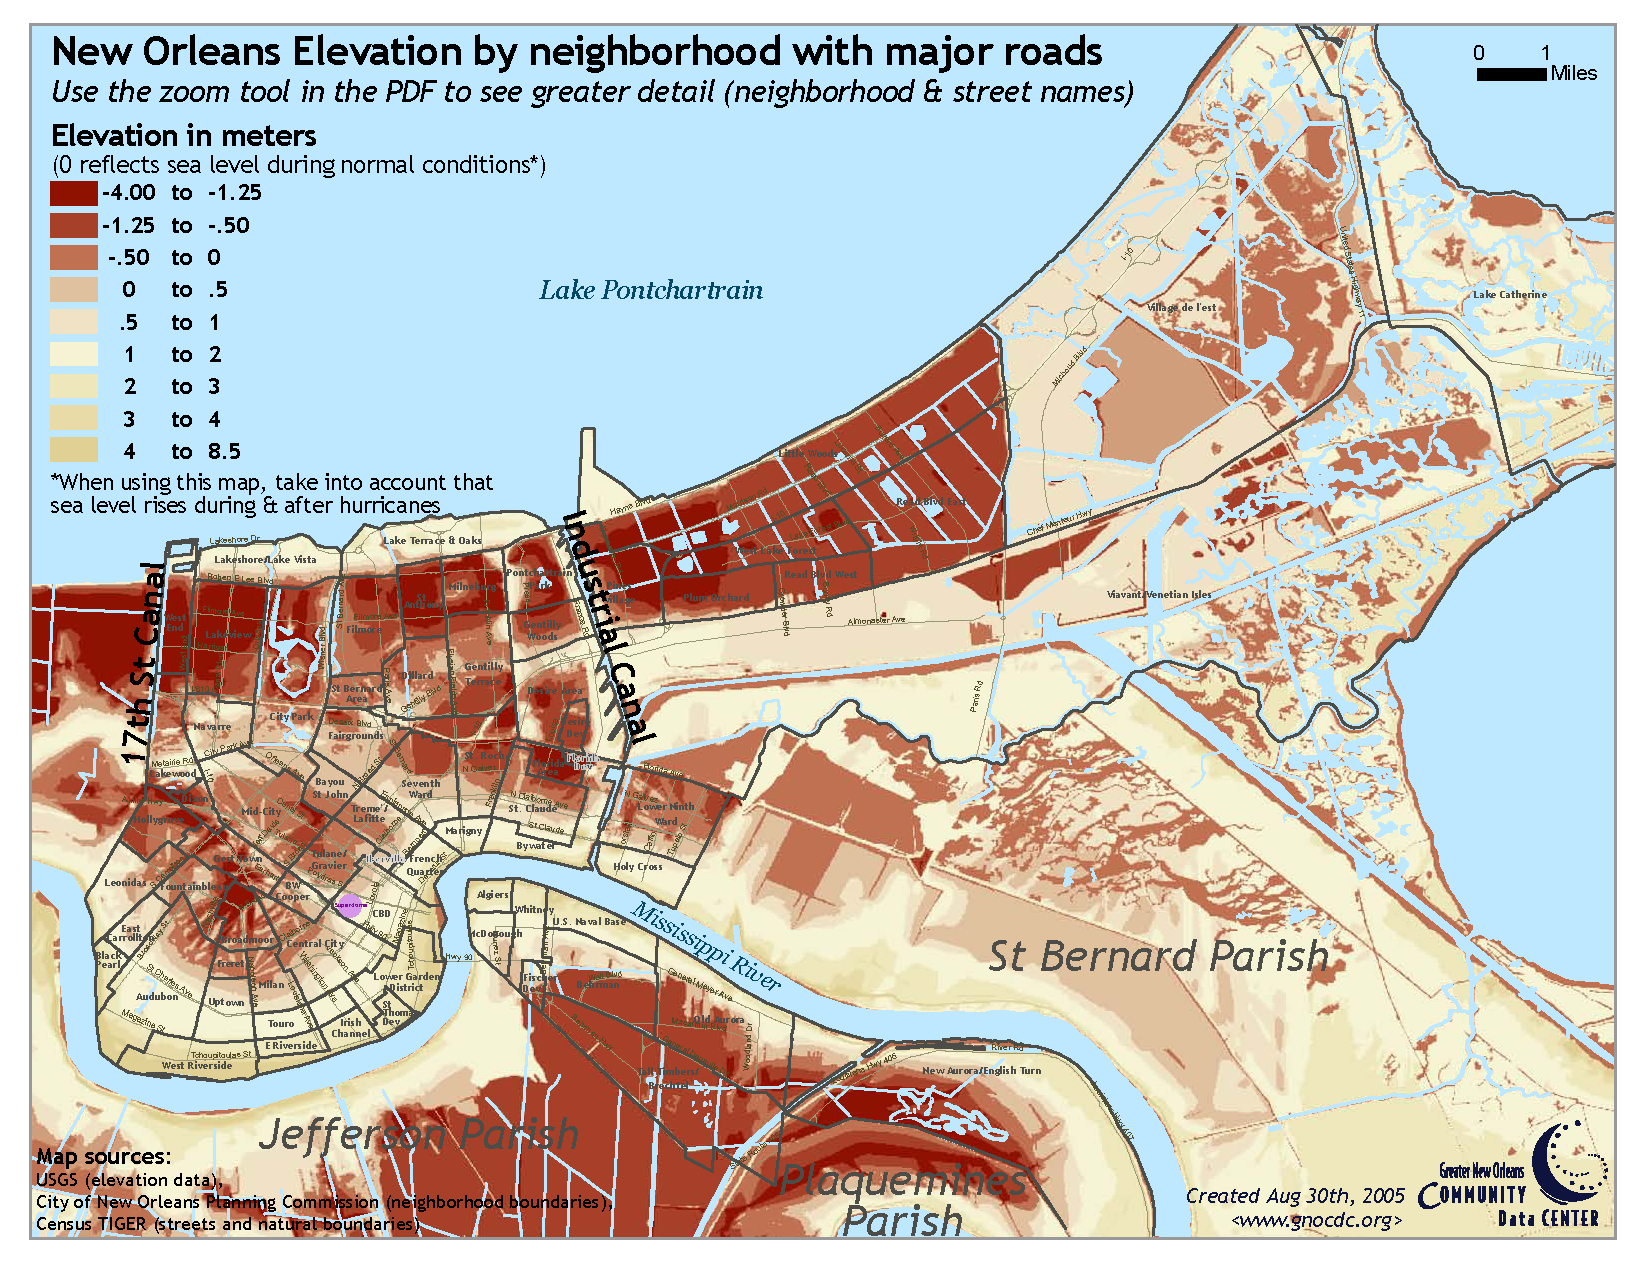
A thread running throughout is that, while neighborhoods may stay the same, the people who live in neighborhoods change over time. As described below, during the latter decades of the 20th century, New Orleans suffered disinvestment as suburban parishes grew, leaving mortality rates in the city higher than in the rest of the metro. However, mortality rates in New Orleans have fallen dramatically since Hurricane Katrina and, since 2017, have actually dropped below mortality rates in suburban parishes. This reversal reflects changing mortality patterns, as well as uneven displacement and recovery since Hurricane Katrina and the levee failures.
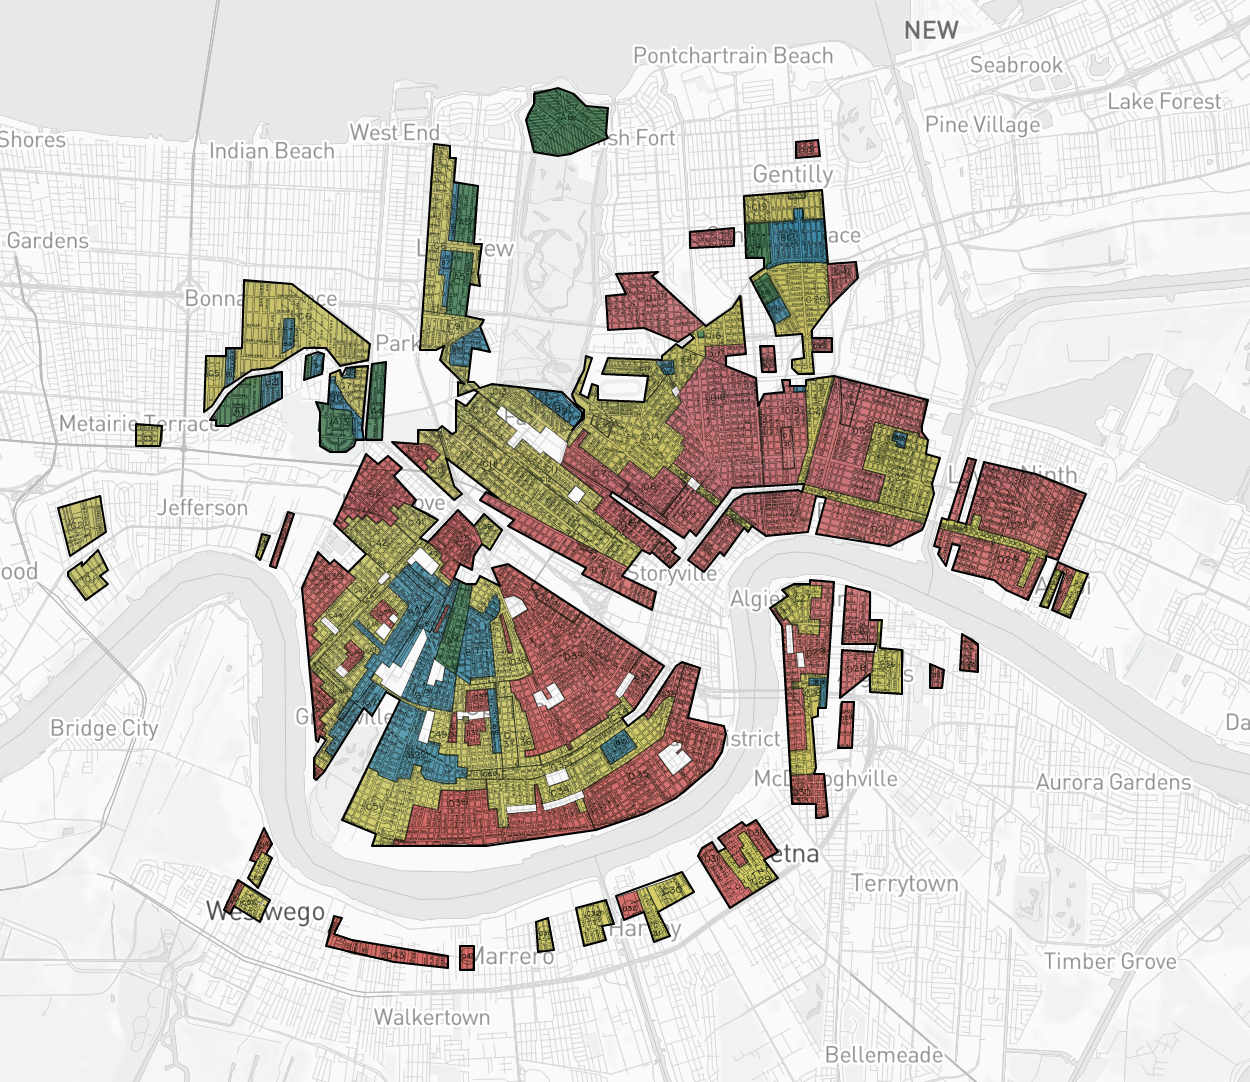
The changing distribution of mortality
New Orleans developed in phases

For a more in-depth historical account of these topics, see Rigging the Real Estate Market: Segregation, Inequality, and Disaster Risk and Three Hundred Years of Human Geography in New Orleans from The New Orleans Prosperity Index: Tricentennial Collection.

The patterns of segregated settlement that governed New Orleans’ rapid 19th century growth echo across neighborhood inequality today.


Between 1810 and 1920, New Orleans’ population grew from 17,000 to nearly 390,000. During this period of rapid growth, residential settlement expanded along higher-lying areas, where sediment deposited by the Mississippi River created a “natural levee.” As the urban footprint gradually encompassed all of today’s historic inner-ring neighborhoods, segregation often restricted working-class and black residents to settling in lower-lying areas, where land and housing were cheaper. This initial pattern of nineteenth-century neighborhood inequality left a lasting legacy. Even today, some “back-of-town” areas have lower life expectancies than other historic inner-ring neighborhoods.

New Orleans’ settlement patterns are closely tied to its natural environment and the efforts of humans to control it. For most of the city’s history, settlement was confined to the natural levee, where sediment deposited by thousands of years of Mississippi River floods left the ground higher and drier. Small differences in elevation dictated where neighborhoods could and couldn’t develop.

When New Orleans’ historic inner-ring neighborhoods first developed, wealthier residents often clustered along major streets where the elevation was high and the risk of flooding low. Recent immigrants, working-class whites, and free people of color tended to reside in “back-of-town” areas farther from the river and closer to the cypress swamps lying behind the natural levee. Here, land and housing were cheaper, and flood and drainage hazards greater. Even as the urban footprint expanded, this fundamental pattern remained until the 1920s and continues to echo across measures on place-based inequality today.

Neighborhood segregation has exceptions and evolves over time
New Orleans Neighborhood Elevation Map

The present-day map of New Orleans neighborhoods was fixed in place during the 20th century, when new policies worked to reinforce racial segregation in housing markets.


Discriminatory real estate practices and policies fundamentally reshaped cities across the United States during the 20th century. “White flight” and racialized federal subsidy drove the process of rapid suburban growth. Investment flocked to newly developed sections of the city of New Orleans and suburban parishes while highway construction, public housing, and “redlining” steered investment away from poor and black neighborhoods. The unmistakable correspondence between redlining maps from the 1930s and the map of life expectancy today highlights continuities with the policies implemented during middle decades of the 20th century.

Redlining and racially restrictive covenants
Life expectancy by census tract, New Orleans metro
# of Tracts
Home Owners' Loan Corporation Redlining Map, 1939
Redlining Map
A: "Best"
B: "Still Desirable"
C: "Definitely Declining"
D: "Hazardous"
 

19th century neighborhood segregation set the stage for the transformative middle decades of the 20th century. New Orleans’ map of neighborhoods was essentially fixed in place during the 20th century, when development in the middle and outer rings completed the geographic transformation of 19th Century New Orleans into the metropolitan region that exists today.

Draining the back swamp primed new land farther from the river for development, namely Gentilly and Lakeview by the 1920s and New Orleans East by the 1960s. The growth of middle-class subdivisions, both in suburban parishes and within newly developed areas of the city of New Orleans, reshaped the regional geography of race and class. “Rigging the Real Estate Market” documents how housing segregation was enforced during a time of transformative regional expansion. A tangle of discriminatory policies and practices held sway during—and in some cases, underwrote—this period of rapid development and redevelopment: restrictive zoning, redlining, racially restrictive covenants in tract housing developments, discrimination in federally backed mortgages, urban renewal and redevelopment programs, the siting and management of public housing, the uneven impacts of highway construction, the placement of water infrastructure projects like the Industrial Canal, and everyday discriminatory practices in the housing market. Similar factors entrenched segregation in most United States metros, but New Orleans is distinctive for how these processes interacted with the city’s pre-existing landscapes of environmental risk and racial segregation.

Highway construction

Though racially restrictive covenants were banned in 1948 and redlining was abandoned in the 1970s, the practices had worked to exclude black and poor neighborhoods from the period of postwar expansion that fundamentally reshaped the metropolitan geography of the United States. Even in the absence of de jure segregation, the housing market continued to operate with different rules for black and white residents.

The metro area continued to add population as the oil and gas sector boomed, but the city of New Orleans’ population peaked in 1960. As “white flight” escalated, white, middle-class families left New Orleans neighborhoods for suburban parishes in large numbers. Similarly, the overwhelmingly white exodus from New Orleans public schools and the redistribution of the region’s tax base ensured that school desegregation would fail to achieve equitable access to quality public education, further amplifying the effects of residential segregation.

The black middle class also began to move out of the historic core, albeit to a narrower set of neighborhoods and in far more limited numbers to the suburbs. For example, faced with a black housing shortage in the 1950s, political and real estate interests aligned behind plans for Pontchartrain Park, which was originally developed as a segregated subdivision and park for black New Orleanians.

Public housing

In the three full decades between the Civil Rights era and Hurricane Katrina, the distribution of socioeconomic status across New Orleans neighborhoods shifted only slightly. Instead, racial segregation drove the process of neighborhood change.


As residents move, the people who make up each neighborhood changes over time. Regional demographic and economic shifts also affect who lives in each neighborhood. Nonetheless, neighborhood inequality tends to be long-lasting. Reforms and policies since the Civil Rights era have yet to overturn centuries of uneven neighborhood investment and exclusion.

Where did the neighborhood names in the chart come from?

The percentage of residents in poverty is a common measure of neighborhood socio-economic status, and long-term changes in neighborhood poverty rates provide a glimpse into the durability of neighborhood inequality. In New Orleans, most income-poor neighborhoods in 1970 continued to be income-poor in 2000.[note] During that time, New Orleans saw demographic changes, an unraveling of legal barriers to housing inclusion, the oil boom and bust, the rise of the tourism and service sectors, rising and falling rates of violence, and the beginnings of neighborhood gentrification. Poverty rates of individual neighborhoods fluctuated, but three decades later only slightly shifted the overall ordering of neighborhoods by poverty rate.

Why do we begin in 1970?
Change in poverty rates in New Orleans neighborhoods, 1970-2000
 

While the distribution of neighborhood socio-economic status shifted only slightly between 1970 and 2000, many New Orleans neighborhoods underwent much more dramatic changes in racial composition. Much of the city’s white population either withdrew to the suburbs or consolidated into a subset of New Orleans neighborhoods. The black share of the population rose in dozens of inner-, middle-, and outer-ring neighborhoods, although the sequencing varied by decade. Some neighborhoods with large black majorities remained consistently black, while others with almost no black residents remained consistently white. In contrast, many neighborhoods transitioned from being racially mixed or even entirely white to majority black. A single neighborhood, Black Pearl, transitioned from majority black to majority white, which illustrates that housing markets remained segregated long after the Civil Rights era.

Economic distress in the 1980s corresponds with life expectancy today
Change in black population in New Orleans neighborhoods, 1970-2000

Hurricane Katrina marked a breaking point, as uneven displacement and recovery upended trends in neighborhood inequality.


On August 29, 2005, Hurricane Katrina and the subsequent levee failures brought the history of environmental risk surging back into the present. The immediate aftermath, response, uneven displacement, and uncertain recovery propelled New Orleans’ long-standing neighborhood and racial inequalities onto a national stage. Katrina dramatically disrupted demographic and housing trends, but how did Katrina change the long-term trajectory of neighborhoods? The data shows that Katrina marks a breaking point in the trends that prevailed from 1970 to 2000.

Displacement and return after Hurricane Katrina

Though New Orleans remains a majority-black city, New Orleans’ black population fell from 67 to 59 percent, a net loss of over 90,000 people between 2000 and 2018. The redistribution of neighborhood advantage and disadvantage also quickened during the post-Katrina period. The shifts since 2000 reflect not only Katrina-related displacement but also the effects of the Great Recession and dramatic increases in housing costs. Between 2004 and 2018, the share of renter households who spent more than 50 percent of household income on housing costs spiked from 24 to 37 percent in New Orleans and from 22 to 32 percent for the metro.

Change in black population in New Orleans neighborhoods, 2000-2017
 

Decreasing percentages of both residents in poverty and black residents offer suggestive evidence of neighborhood gentrification in some inner-ring neighborhoods. The share of black residents has fallen in many of these inner-ring neighborhoods, marking a reversal of the pattern that prevailed from 1970 to 2000. Meanwhile, across the metro, the incidence of poverty has, to an extent, spread both to suburban parishes and to outer-ring neighborhoods within the city. Poverty rates in several middle- and outer-ring neighborhoods with significant black populations (e.g., in Gentilly, New Orleans East, and Westbank) are higher than they were in 2000.

Change in poverty rates in New Orleans neighborhoods, 2000-2017
 

Between 1999 and 2018, the poverty rate in New Orleans declined from 28 percent to 24 percent, while poverty across the metro area remained statistically unchanged at 18 percent. However, the share of New Orleans residents living in neighborhoods of concentrated poverty plummeted from a high of 30 percent in 1990 to 21 percent in 2000 and less than 11 percent in 2013-2017.[note]

Poverty may be far less concentrated today, but despite the effects of Katrina-related displacement and uneven neighborhood change, the past 50 years have left a measurably enduring legacy of neighborhood inequality.

Percent of residents living in neighborhoods of concentrated poverty, 1970-2017

Conclusion

Snapshot data on life expectancy may be informative, but it can only reveal so much about how place both reflects and maintains longstanding inequities. Throughout the course of their lives, people may move between different neighborhood contexts. As they do so, and as metropolitan economies and demographics evolve, neighborhoods change. Through continued migration to the suburbs, the rough 1980s regional economy, urban policy reforms, and the post-Katrina period, New Orleans’ neighborhoods have changed since the end of the Civil Rights era. Still, old patterns of neighborhood inequality continue to resonate across contemporary differences in life expectancy and economic opportunity. At the very least, these historical findings suggest that feasibly reducing place-based inequality would require sustained investment. What else do these findings imply for interventions to flatten differences in neighborhood life expectancies? Continue to Chapter 3 for implications of constraints on upward mobility—from place-to-place and generation-to-generation—for place-based policies.

×
New Orleans developed in phases
As the city grew, neighborhoods developed in sequence across three "rings." For each ring, a different set of conditions governed how, when, and for whom different parts of the city developed:
  1. The inner ring: Elevated areas where neighborhoods developed before 1900. It includes much of the historic core along the river and near the CBD, and much of Mid-City, St. Roch and the Seventh Ward, and Algiers.
  2. The middle ring: Low-lying areas where neighborhoods developed between 1900 and 1950. It includes Lakeview and Gentilly neighborhoods, along with Broadmoor, Gert Town, and the Lower Ninth Ward.
  3. The outer ring: Areas further from the historic core where neighborhoods developed after 1950. It includes most of New Orleans East and parts of the West Bank. Most residential development in suburban parishes also falls within this group.
×
Neighborhood segregation has exceptions and evolves over time
Despite its characteristic front-of-town/back-of-town pattern of segregation, 19th century New Orleans had a unique mix of enslaved and free black populations and a growing population of European immigrants may have appeared, arguably, less spatially segregated than in other large, growing cities at the time. For example, before the abolishment of slavery, the city’s enslaved black population usually lived among its slaveholding population. Even into the 20th century, black domestic workers routinely lived near the houses where they worked, while black port workers tended to settle in neighborhoods close to the river. One result was that Uptown neighborhoods developed with a fine-grained pattern of racial segregation, still observable in neighborhood demographics to this day. Yet as immigrants and emancipated African Americans continued to migrate to the city after the Civil War, the mounting white-supremacist fervor of the Jim Crow era worked to “exert ever-greater pressure on African American populations to live in less desirable, nuisance prone areas. Rarely were the resulting black settlements without urban nuisances or environment risks.”
×
Redlining and racially restrictive covenants
During the sluggish Great Depression economy of the 1930s, new federal mortgage-backing agencies enshrined the practice of “redlining.” Government agencies adopted maps to designate the financial risk involved with real estate investments, with the areas deemed the highest risk coded “red.” These ratings categorized racially homogeneous, white areas with newer housing stock as low-risk while neighborhoods with older housing stock and even a small black population tended to receive a “red” designation. By prioritizing new construction in new suburban areas subject to discriminatory restrictions and curtailing investment in black neighborhoods, federally backed mortgages fueled racial segregation during the postwar housing boom.
×
Highway construction
The construction of the Interstate Highway System devastated inner-city neighborhoods across the country. Highways promote suburban growth by shortening commutes between distant residential areas and downtown employment centers. Routinely, highway planners viewed decisions over highway routing and construction as opportunities to remove “slum” housing and reduce contact in downtown areas between black people and white professionals and shoppers. New Orleanians widely consider the siting of the Interstate 10 overpass and ramps through Treme to have decimated a once-thriving strip of black-owned businesses along formerly tree-lined Claiborne Avenue.
×
Public housing
A major justification for federal public housing involved the upgrading of sub-standard housing conditions in low-income neighborhoods, but the results departed widely from this goal. New Orleans’ first public housing opened in Treme and Uptown in 1941, and construction of additional developments continued through the 1960s. At first, public housing was segregated, with white projects often sited in more desirable areas and on higher ground. Beginning in 1950, the adoption of strict income restrictions began to force out working- and middle-class white and black tenants. As paying tenants left, the loss of rent stressed maintenance budgets and conditions deteriorated. Perceptions of public housing in New Orleans and other cities fed federal policy debates over extreme “concentrated black poverty” and, beginning in the 1990s, a complete physical and programmatic overhaul of public housing. As in other cities, the siting and management of New Orleans’ large-scale public housing ultimately had the effect of entrenching neighborhood inequality.
×
Where did the neighborhood names in the chart come from?
Unless otherwise noted, The Data Center’s “neighborhood statistical areas” are used to organize and present data on neighborhoods in this section. These designations align with Census tract boundaries, so data can be organized into neighborhood groupings. See The Data Center website for more on the neighborhood statistical areas and the challenges of defining neighborhoods for analysis.
×
Why do we begin in 1970?
First, 1970 is the first year for which population characteristics are available at the census tract level for New Orleans. This allows us to compare historical data with contemporary data, including life expectancy. Second, this time frame corresponds with the central question addressed in The New Orleans Prosperity Index: “Have African American New Orleanians experienced increased economic inclusion since the end of the Civil Rights era?”
×
Economic distress in the 1980s corresponds with life expectancy today.
During the 1980s, the oil crash devastated the regional economy. Median household incomes declined, sharply for black households. Eighteen percent of New Orleanians lived in neighborhoods with poverty rates 40 percent or higher in 1980. By the end of the decade, this rate had jumped to 30 percent, as poverty rates rose in neighborhoods across the metro. Although the regional economy and neighborhood poverty rates recovered during the 1990s, census tracts where poverty increased most during the 1980s tend to have lower life expectancies today.
×
Displacement and return after Hurricane Katrina
Hundreds of thousands of New Orleanians and Gulf Coast residents were displaced to cities across the country. The neighborhoods that experienced the highest degrees of displacement and the greatest barriers to recovery were those where flood damage combined with long-term disadvantage. As the most affected parishes recovered, the rate of population growth and thus the rate of neighborhood demographic change was unusually rapid through the early 2010s. Yet just as the experience of displacement was distributed inequitably, so were the barriers to return. For example, 70 percent of the city’s long-term white residents but only 42 percent of long-term black residents made their way home by the end of the first year. The allocation of most federal dollars to rebuilding owner-occupied housing meant that renters, who as a group are disproportionately likely to have lower-incomes and to be African American, typically faced more obstacles to return. Factors like access to job opportunities and having school-aged children also constrained the ability to return promptly. In short, a range of factors shaped the uneven recovery of neighborhoods and the ability of residents to return in the short-, medium-, and long-term.
×
Neighborhoods and public goods
Access to public goods like parks and public transportation varies from neighborhood to neighborhood. Public goods can affect life expectancy indirectly. For example, access to transit might shape job opportunities, and economic security affects life expectancy. Public goods can also affect life expectancy directly. For example, parks and recreational activities can promote healthy behaviors and reduce stress, which in turn impacts health and life expectancy.