Technical Appendix
The New Orleans metro
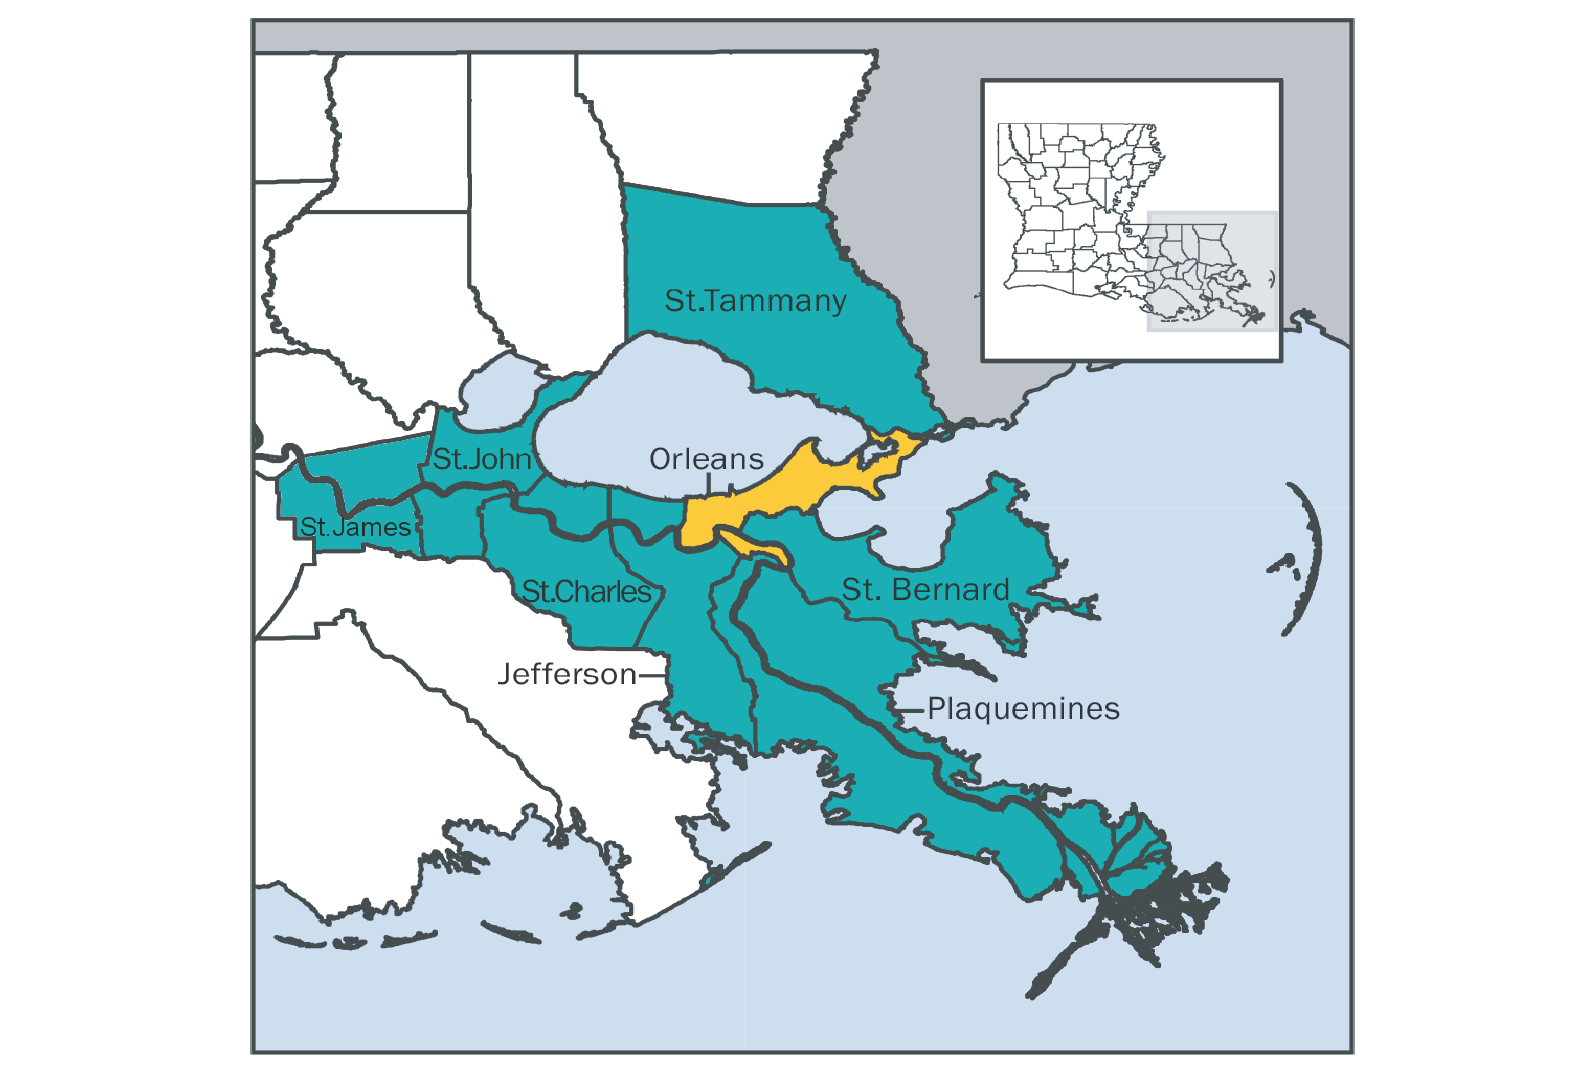
Unless otherwise noted, this report focuses on data across the 8-parish New Orleans-Metairie Metropolitan Statistical Area (MSA). The MSA includes Jefferson, Orleans, Plaquemines, St. Bernard, St. Charles, St. James, St. John the Baptist, and St. Tammany Parishes.
Life expectancy at the census tract level
Released by the Centers for Disease Control and Prevention, the United States Small-area Life Expectancy Estimates Project (USALEEP) is a period life expectancy measurement. Life expectancy was calculated using vital statistics on the rates of death by age group and location of residence (census tract) over a specific time period (2010 to 2015). As detailed in the study methodology, the dataset covers most census tracts in the United States, aside from Maine and Wisconsin. Though this level of geographic coverage and detail is unprecedented, the data is not without limitations. Estimates are based on deaths that occurred within a given neighborhood at a given time, so they extrapolate from where an individual was living at the time of death, not from the potential “exposure” to other neighborhood contexts during the course of an individual’s life. In addition, like most estimates, the data are subject to error. Statistical models were developed to address the challenges posed by small population sizes, and some census tracts were excluded from the study due to small population sizes.
National Center for Health Statistics. U.S. Small-Area Life Expectancy Estimates Project (USALEEP): Life Expectancy Estimates File for United States, 2010-2015. National Center for Health Statistics. 2018. Available from: https://www.cdc.gov/nchs/nvss/usaleep/usaleep.html.
Life expectancy for selected countries
World Bank analysis of: (1) United Nations Population Division. World Population Prospects: 2019 Revision, or derived from male and female life expectancy at birth from sources such as: (2) Census reports and other statistical publications from national statistical offices, (3) Eurostat: Demographic Statistics, (4) United Nations Statistical Division. Population and Vital Statistics Report (various years), (5) U.S. Census Bureau: International Database, and (6) Secretariat of the Pacific Community: Statistics and Demography Programme.
Deaths from external causes and chronic diseases
Mortality data are published by the National Center for Health Statistics at the Centers for Disease Control and Prevention. More specifically, the data included in this report was sourced from the Underlying Cause of Death 1999-2018 database, released in 2020 and accessed via on CDC WONDER online databases on Feb 19, 2020. Data are from the Multiple Cause of Death Files, 1999-2018, as compiled from data provided by the 57 vital statistics jurisdictions through the Vital Statistics Cooperative Program. Accessed at http://wonder.cdc.gov/ucd-icd10.html on Feb 19, 2020.
Causes of death (and corresponding International Statistical Classification of Diseases and Related Health Problems, Tenth Revision [ICD-10] codes) include unintentional drug poisoning (X40-X44), alcoholic liver disease (K70), intentional self-harm (suicide) (X60-X84), neoplasms (cancer) (C00-D48), ischemic heart disease (heart disease) (I20-I25) and human immunodeficiency virus [HIV] disease (B20-B24).
Mortality rates by age group, race, and geography
Three-year averages from 1999 to 2016 and a two-year average for 2017-2018 are used to ensure means reported are not skewed by outliers in any one year. Mortality trends for youth and elderly only contain 1999-2001 and 2017-2018 averages because of missing data. "Black" indicates Black or African American, not Hispanic; and "white" indicates white, not Hispanic.
Centers for Disease Control and Prevention, National Center for Health Statistics. Underlying Cause of Death 1999-2018 on CDC WONDER Online Database, released in 2020. Data are from the Multiple Cause of Death Files, 1999-2018, as compiled from data provided by the 57 vital statistics jurisdictions through the Vital Statistics Cooperative Program. Accessed at http://wonder.cdc.gov/ucd-icd10.html on Feb 19, 2020.
Geographic aggregation of life expectancies
The USALEEP data describes census tracts for the period 2010-2015. A pooled population number was used to calculate each tract's life expectancy; specifically, this number is the sum of the tract's 2010 Census population and its 2011-2015 American Community Survey 5-year population estimate. To find the life expectancy of other, higher-level geographies, such as parishes, states, and the whole United States, a weighted mean of the geography's component tracts is calculated using the pooled population estimate as the weight. Tracts without data from USALEEP are excluded from this calculation. This same process is used to calculate the aggregated probabilities of death.
The Data Center analysis of National Center for Health Statistics. U.S. Small-Area Life Expectancy Estimates Project (USALEEP): Life Expectancy Estimates File for United States, 2010-2015. National Center for Health Statistics. 2018. Available from: https://www.cdc.gov/nchs/nvss/usaleep/usaleep.html. The Data Center analysis of U.S. Census 2010 Summary File 1 (SF1) and 2011-2015 American Community Survey."
Tracts without a life expectancy measure
Some tracts are missing from the USALEEP data. Each tract must meet a few criteria to be included in the USALEEP data. First, a tract must have a pooled population size of 5,000 or more. Second, in the case of age groups with zero deaths, the USALEEP team had to predict the given age-specific death count, and the tract must exhibit an "acceptable age pattern of mortality." Finally, the standard error of life expectancy at birth must be less than four years.
Calculating majority-Black tracts
In order to investigate the racial disparity of life expectancy, the proportion of Black residents in each tract was calculated using the 2011-2015 American Community Survey. Tracts with 50% or more Black residents are considered majority Black.
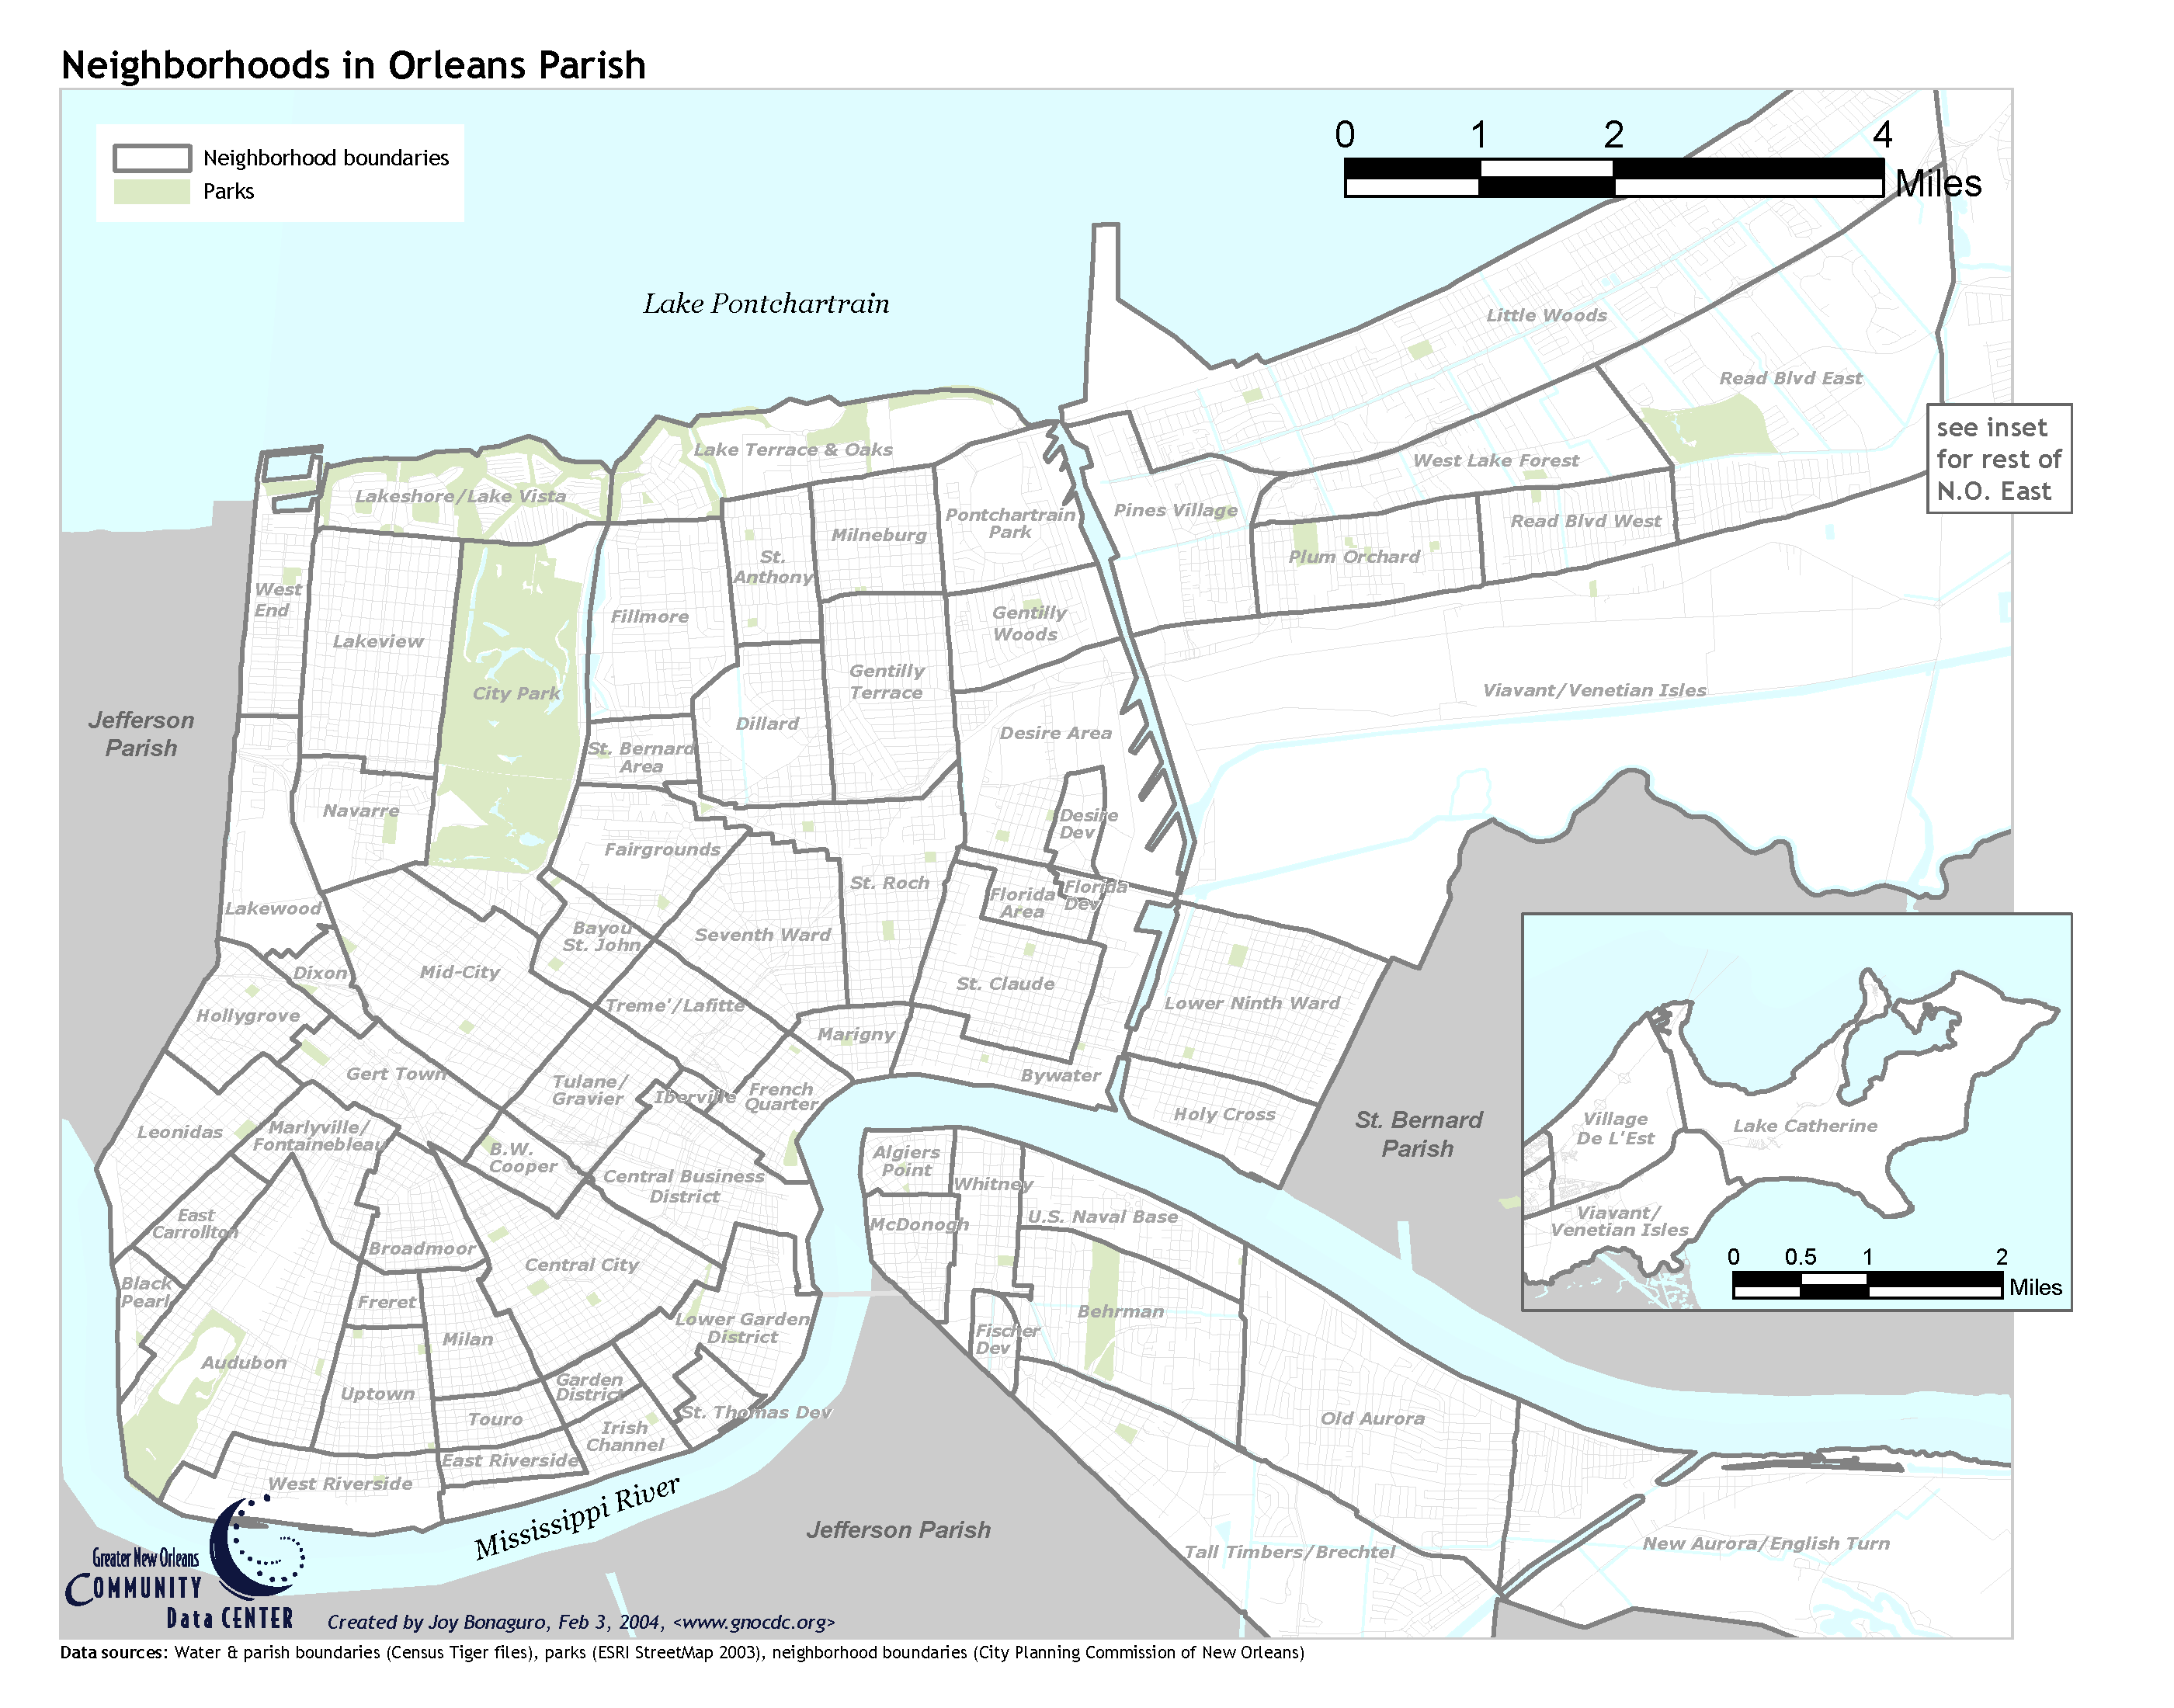
New Orleans neighborhood statistical areas
The Data Center’s “neighborhood statistical areas” are used to organize and present data on the changing poverty rates and racial composition of New Orleans neighborhoods since 1970. These designations align with census tract boundaries, so estimates can be aggregated into simplified neighborhood groupings. The same definitions are used in The Data Center’s Neighborhood Profiles web resource.
The Data Center’s neighborhood statistical areas are originally based on City Planning Commission boundaries from the city of New Orleans, first designated in the 1980s. While these definitions have practical advantages for compiling data, both the concept of a neighborhood and the specific boundaries of neighborhoods are subject to many interpretations. Additional background can be found in a note on The Data Center website. A reference map of these neighborhoods is available in figure 3.6 and in the reference maps section of The Data Center website.
Redlining map
The redlining map was downloaded from the “Mapping Inequality: Redlining in New Deal America” website of the University of Richmond’s Digital Scholarship Lab.[note] The website makes interactive versions of redlining maps available for dozens of cities across the United States, with data available for download. To better match our maps, we use a slightly distorted but “geo-rectified” version of the scanned archival map images. Robert K. Nelson, LaDale Winling, Richard Marciano, Nathan Connolly, et al., “Mapping Inequality,” American Panorama, ed. Robert K. Nelson and Edward L. Ayers, accessed March 16, 2020, https://dsl.richmond.edu/panorama/redlining/.
Change in race and poverty rates in New Orleans neighborhoods, 1970-2000 and 2000-2017
The analysis presented here follows the Sampson’s descriptive analysis of changes to Chicago neighborhoods.[note] The graphs use decennial U.S. census data from 1970 to 2000 (GeoLytics 2004; Minnesota Population Center 2011), as well as American Community Survey (ACS) data from 2013 to 2017. The GeoLytics data provides estimates that have been harmonized over time to adjust for changing census tract definitions and boundaries.
The Data Center analysis of GeoLytics. “CensusCD Neighborhood Change Database Long Form”. 2003. East Brunswick, NJ. GeoLytics, Inc. and the 2013-2017 American Community Survey.
Percent of residents living in neighborhoods of concentrated poverty
To enable census tract comparisons over time, this graph uses decennial U.S. census data from 1970 to 2000 (GeoLytics 2004; Minnesota Population Center 2011), as well as American Community Survey (ACS) data from 2013 to 2017. The percent of residents living in concentrated poverty is the number of families that live in census tracts with 40 percent or more of the residents living below the official poverty threshold divided by the entire geography’s population.
The Data Center analysis of GeoLytics. CensusCD Neighborhood Change Database Long Form. 2003. East Brunswick, NJ. GeoLytics, Inc. and the 2013-2017 American Community Survey.
Income segregation by neighborhood
This analysis follows a methodology derived from a series of reports on income segregation by Reardon and Bischoff, which describe the analysis in greater detail.[note] Aside from resolving the issue of changing census tract boundaries with the GeoLytics data set, one of the main challenges is to derive a consistent measure of income, e.g., median family income was not available for 1970 or 1980. To reduce bias, the same methodology was used each decade to interpolate median family income of New Orleans Metro using counts of families within income range (bins). The income bin that contains the 50th percentile of the total population count was identified. The family income of the 50th percentile family was estimated by assuming the population within the income bin is evenly distributed across the bin’s income range. The most recent estimates are derived from American Community Survey 2013-2017 and uses household income whereas previous years use family income.
The Data Center analysis of GeoLytics. CensusCD Neighborhood Change Database Long Form. 2003. East Brunswick, NJ. GeoLytics, Inc. and the 2013-2017 American Community Survey.
Childhood income mobility data
The data on childhood income mobility is derived from a series of papers by Chetty, Hendren, and others, chiefly “The Opportunity Atlas: Mapping the Childhood Roots of Social Mobility.”[note] The Opportunity Atlas relies on linking confidential federal income tax returns with confidential Census data.
With a sample of over 20 million records, the underlying dataset covers a cohort of 96 percent of children born in the US between 1978 and 1983, as well as authorized immigrants who came to the U.S. during childhood. The researchers estimated average adult outcomes for these children (then in their mid-30s) based on their childhood neighborhoods and demographic and household income characteristics. To derive childhood income percentiles, children are linked to parents based on dependent claims on tax returns. The researchers published publicly available versions of the study dataset that have been aggregated to the census tracts, counties/parishes, and commuting zones. The public data includes suppression and random noise to remove unreliable estimates and to protect confidentiality. Since the data is only provided for Commuting Zones and not for Core-based Statistical Areas (Metropolitan and Micropolitan), regional estimates also include Washington Parish (excluded from the New Orleans-Metairie MSA used in the rest of the report). Since Washington Parish is less than 4 percent of the Commuting Zone’s total population, any regional estimates should be considered generally comparable.
All of the data can be found on the Opportunity Insights website, along with an interactive map (opportunityatlas.org), extensive documentation, the full study, and an accessible summary. Chetty, Raj, John Friedman, Nathaniel Hendren, Maggie R. Jones, and Sonya Porter. Working Paper. “The Opportunity Atlas: Mapping the Childhood Roots of Social Mobility.” Paper, Executive Summary, Slides Online web tool: https://opportunityatlas.org.
Rent and affordability
The rent and affordability analysis is based on tract-level gross rent and median household income.
Gross rent is the total gross rent for all renter-occupied housing units paying cash rent in this area, divided by the total number of renter-occupied housing units paying cash rent in this area. Gross rent is the contract rent (the monthly rent agree to or contracted for with or without utilities or other services) plus the estimated average monthly cost of utilities (electricity, gas, water and sewer) and fuels (oil, coal, kerosene, wood, etc.) if these are paid by the renter (or paid for the renter by someone else). Gross rent is intended to eliminate differentials that result from varying practices with respect to the inclusion of utilities and fuels as part of the rental payment.
To determine affordable housing costs, the common threshold that a household paying 30 percent or more of income on housing is cost-burdened was used: a household can “afford” to put 30 percent of their income towards housing.
For this analysis, New Orleans metro tracts were divided into quintiles (five chunks) based on their life expectancies. For each quintile, the tracts’ average gross rents and median household incomes were averaged with the respective measure’s population number used as a weight.