Fewer jobs mean fewer people and more vacant housing
Published: May 02, 2011
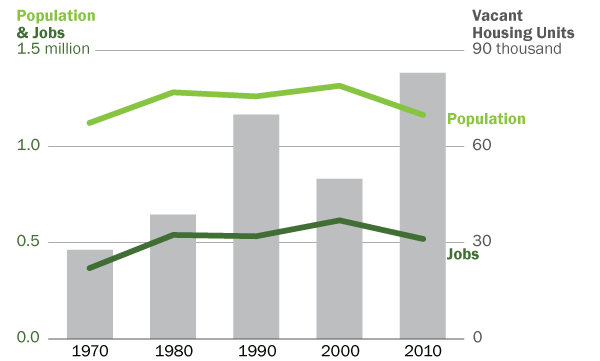
Population, jobs and vacant housing units
New Orleans metro
Sources:The Data Center analysis of data from U.S. Census Bureau, Bureau of Labor Statistics and Moody’s Economy.com Database (U.S. Bureau of Labor Statistics: CES, QCEW).
The New Orleans metro population grows and shrinks in parallel with jobs, leaving behind vacant housing after each contraction. The city and the suburbs can compete for residents, but at the end of the day, the total population of the metro area is, to a large extent, bounded by the strength of the metro area economy. What can be done to reverse population loss and, thereby, reduce blight in New Orleans specifically? Improving schools and city services is important, but equally important is growing the number of higher paying jobs available across the entire metro.
How are jobs, population, and vacant housing related?
While the relationship between the number of jobs, people and housing units within a metro area is complex, Census Bureau research reveals that job opportunities are the main reason people move long distances, such as from one metro area to another [1]. When jobs decline in one metro area, people are often forced to re–locate to another metro area to find work. An outflow of population without a corresponding influx results in excess housing units, and higher vacancies.
How has the job market impacted population and vacant housing in the New Orleans metro over the past four decades?
1970s: The population of the New Orleans seven–parish metro area has not grown significantly since the 1970s—the last time the regional economy enjoyed considerable job expansion. In that decade the metro added 175,100 jobs, growing its job base by 48 percent. The U.S. also grew jobs during the 1970s, but at nearly half the pace (27 percent) compared to the New Orleans metro. Reflecting its economic prosperity, the metro area population grew 14 percent between 1970 and 1980, outpacing the nation’s growth rate of 11 percent. The number of vacant housing units at the end of the decade was relatively low at 41,010 [2].
1980s: In the 1980s when the oil bust hit, the metro’s population shrank one percent as the metro lost 9,434 jobs, or two percent of all jobs between 1980 and 1990. Meanwhile, most other metros increased their number of jobs, attracting un– and under–employed workers from weaker metros like the New Orleans metro [3]. The number of vacant housing units jumped up to 70,097 by the end of this decade.
1990s: From 1990 to 2000, the metro area population grew only sluggishly, by four percent, while the entire country grew 13 percent. Once again, these relatively weak population gains reflect relatively weak job growth. Despite weak population growth, the number of vacant housing units dropped to 50,042 by 2000 as vacant homes were demolished or became so dilapidated they were no longer counted as housing units.
2000s: Between 2000 and 2010, metro area jobs shrank 16 percent and the population of the metro area shrank 11 percent. Many perceive that the New Orleans area failed to regain its total pre–Katrina population because it failed to rebuild all of its pre–Katrina housing. In fact it was the destruction to jobs that kept our population from fully rebounding. If today we had just as many jobs as ten years ago, more workers and their families would have returned or moved here to fill those jobs, and more housing would have been built or rehabbed to meet greater demand.
How has the New Orleans metro’s population loss over the last decade compared to population loss in other metro areas?
It has been well reported that the city of New Orleans lost 29 percent of its population between 2000 and 2010. Yet perhaps more concerning is the fact that the entire metro area lost 11 percent of its population. Among the largest 100 metros, only seven other metro areas lost population from 2000 to 2010, and the loss of population from the New Orleans metro at 11 percent was by far the highest loss rate of all.
Percent change in population, 2000–2010
Metro areas that lost population
Source: The Data Center analysis of data from Census 2000 and Census 2010.
What can New Orleans do to attract population and reduce blight?
The number of jobs across the New Orleans metro is now four percent smaller than in 1980, and the population is nine percent smaller. However, the number of housing units has grown and is now ten percent larger than in 1980. Thus, the number of vacant housing units across the metro has more than doubled over the last three decades from 41,010 to 83,093.
To sustainably address blight within the city, and, at the same time, preserve our treasured historic architecture, New Orleans must not only compete with suburban parishes for residents by reducing crime and improving schools and other city services. Leaders in New Orleans must also work together with other regional leaders to grow the regional economy and create more jobs.
Data Sources
The source for all population and housing unit data in this brief is the U.S. Census Bureau Decennial Census. For every decade, data for the New Orleans metro are calculated based on the seven parishes that make up the 2009 Office of Management and Budget definition of the New Orleans–Metairie–Kenner Metropolitan Statistical Area (Jefferson, Orleans, Plaquemines, St. Bernard, St. Charles, St. John the Baptist, and St. Tammany). Calculations of population change between 2000 and 2010 in the top 100 metros are also based on consistent 2009 Office of Management and Budget metro area definitions.
The source for metro area job data for 1970 and 1980 is the Moody’s Economy.com Database (U.S. Bureau of Labor Statistics: CES, QCEW). The source for metro area job data for 1990, 2000 and 2010 is the Bureau of Labor Statistics (BLS) Current Employment Statistics. All metro area job data are based on consistent 2009 Office of Management and Budget metro area definitions. The source for United States job data is the BLS Current Employment Statistics.
[1] Based on surveys conducted by the Census Bureau, employment–related reasons are the primary reason why people move distances of greater than 50 miles. For example, among people in the United States who moved between 200 and 499 miles, 54 percent moved for an employment–related reason compared to 19 percent for a family–related reason and 14 percent for a housing–related reason. Employment–related reasons include a new job or job transfer, to look for work, to be closer to work, retirement, and other job–related reasons. See U.S. Census Bureau, “Geographic Mobility: 2008 to 2009” (Table 27), accessed online at http://www.census.gov/population/www/socdemo/migrate/cps2009.html.
[2] To be counted as a housing unit, the Census Bureau requires that a residential building not be open to the elements—that is, it must have a roof, windows and doors protecting it. Some of the most severely dilapidated homes in New Orleans, therefore, are likely not included among the “vacant” housing units.
[3] For example, among 57 other “weak city” metro areas, only 6 lost jobs between 1980 and 1990. These 57 “weak city metros” were selected from a 2007 Brookings report, Restoring Prosperity: The State Role in Revitalizing America’s Older Industrial Cities. In this report, Brookings identifies New Orleans among a group of 65 older industrial cities that have experienced decades of economic decline. The 65 weak cities yielded 57 “weak city” metros because a few of the 65 cities were in the same metro area, New Orleans was deleted, and the metro area for one city (Newark NJ) was omitted as it is part of the much larger and stronger New York City metro area.