Published: Dec 19, 2013
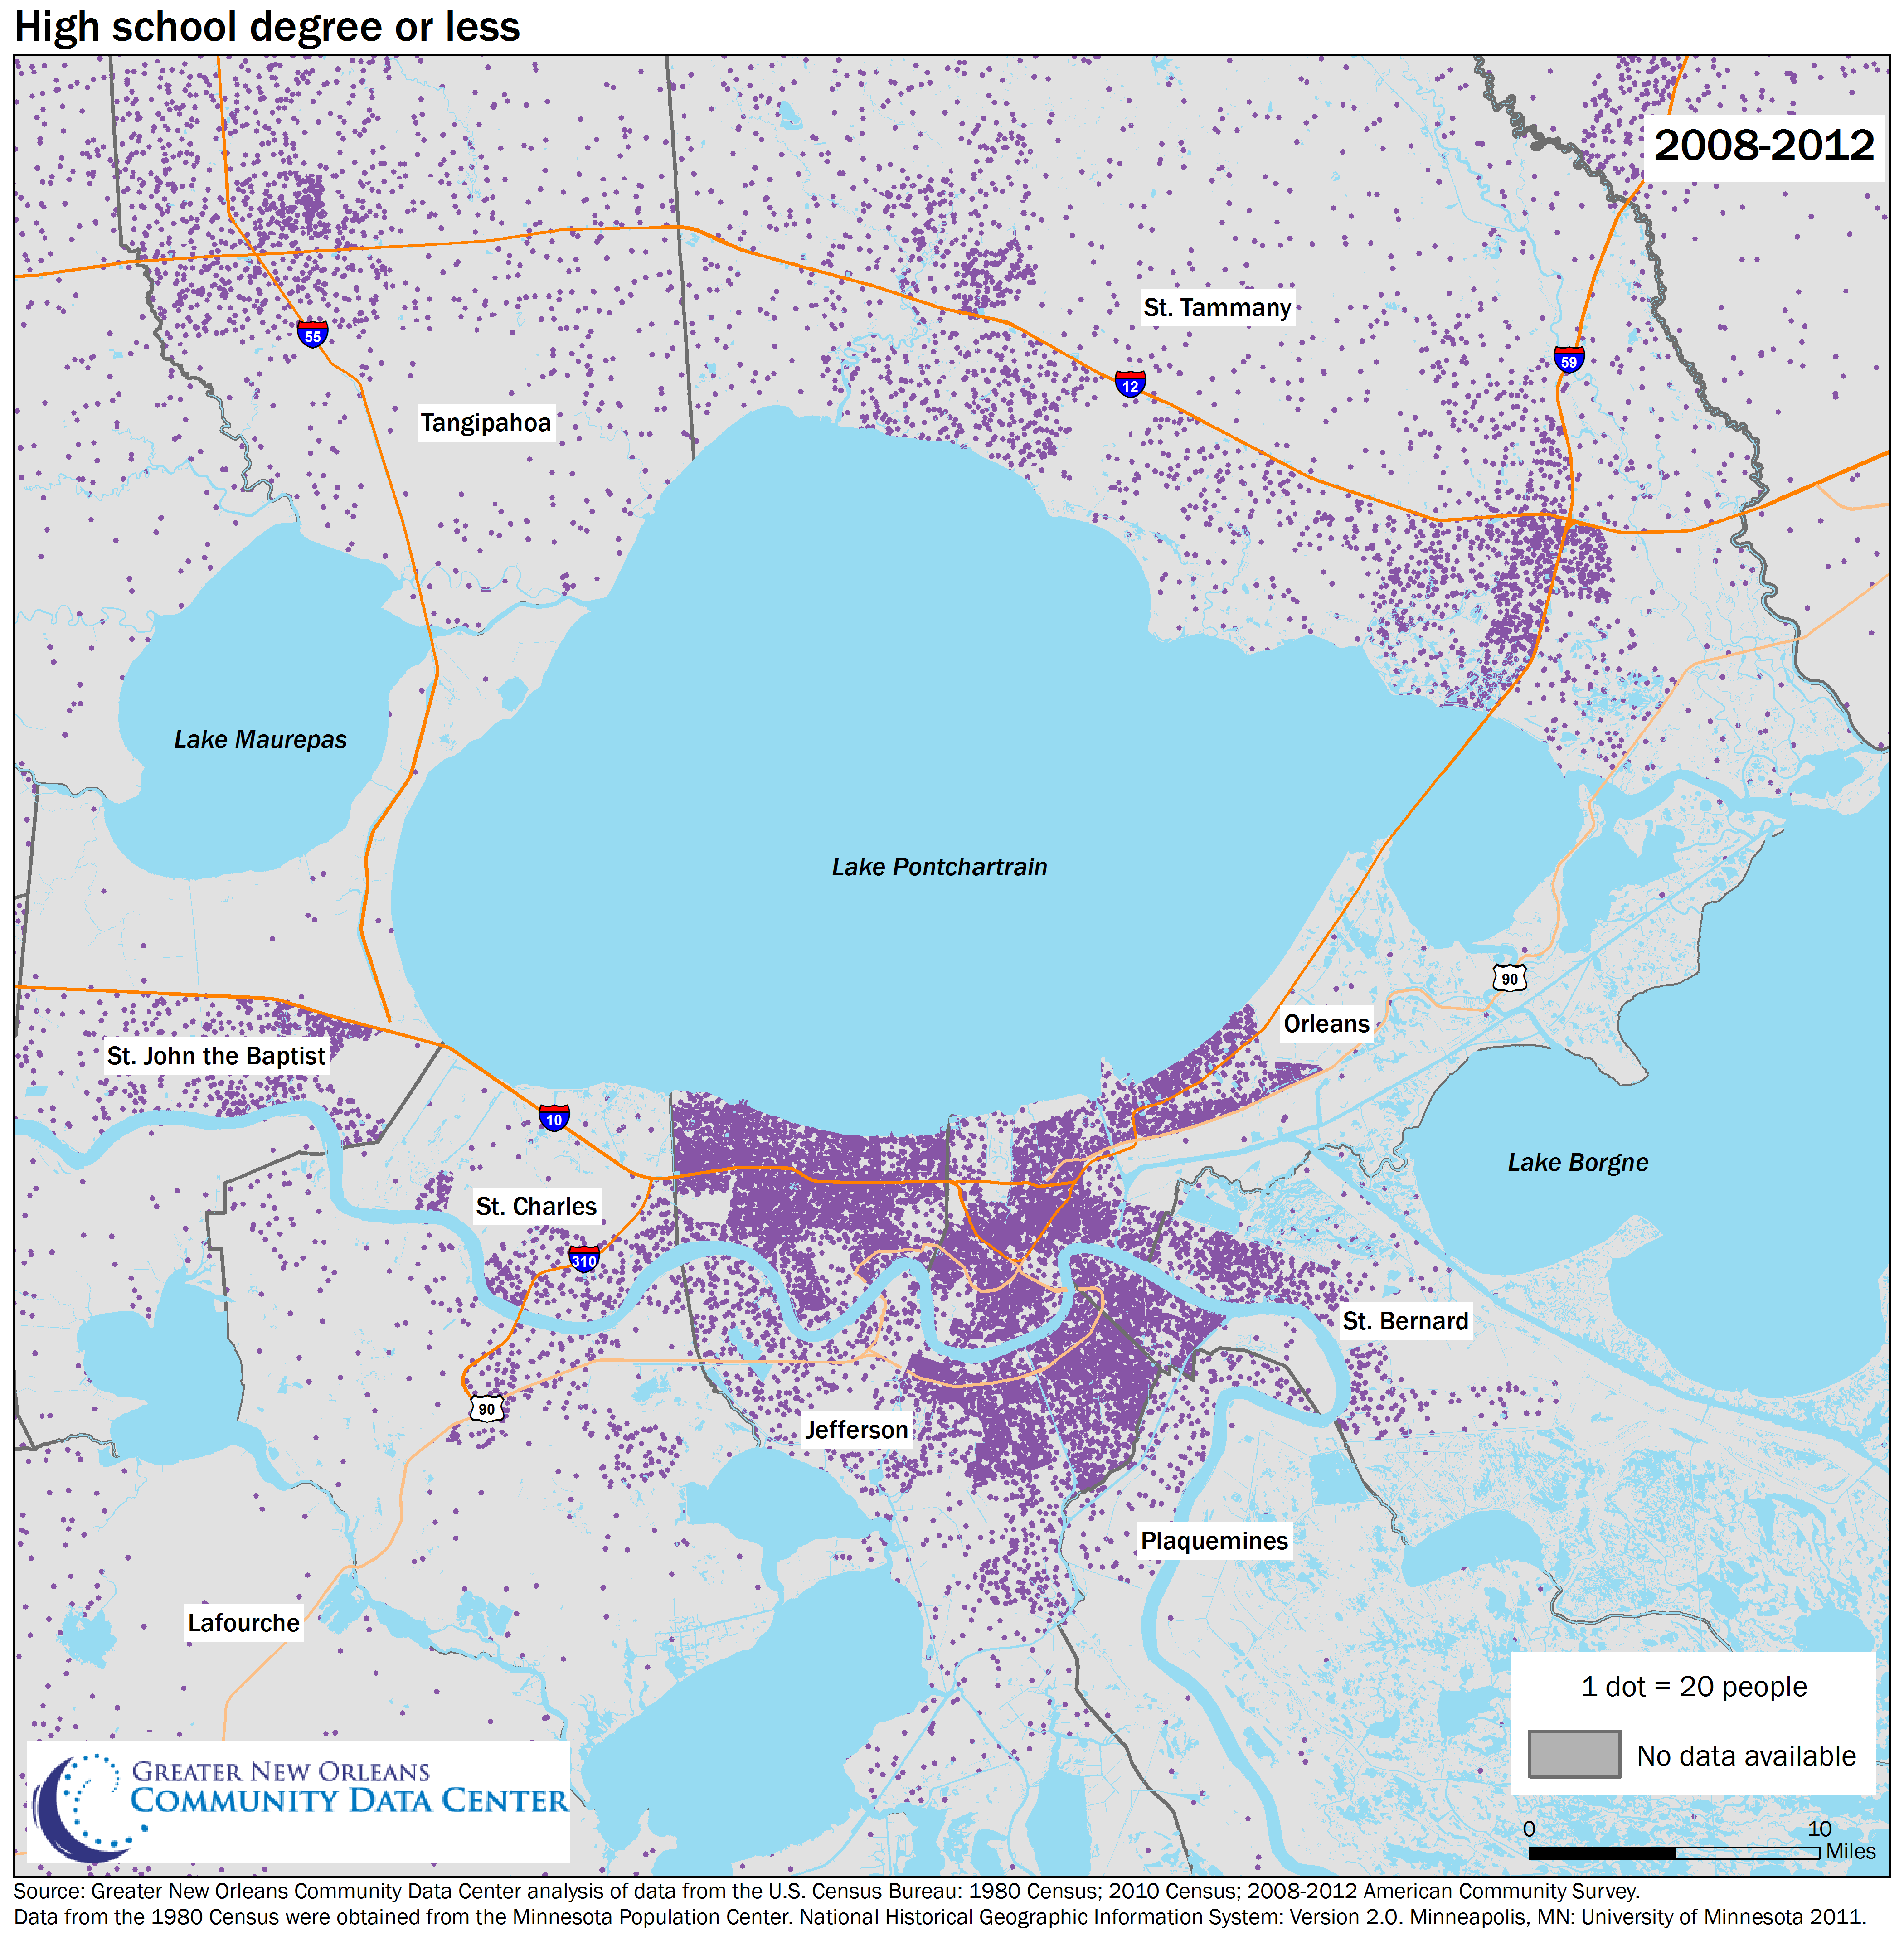
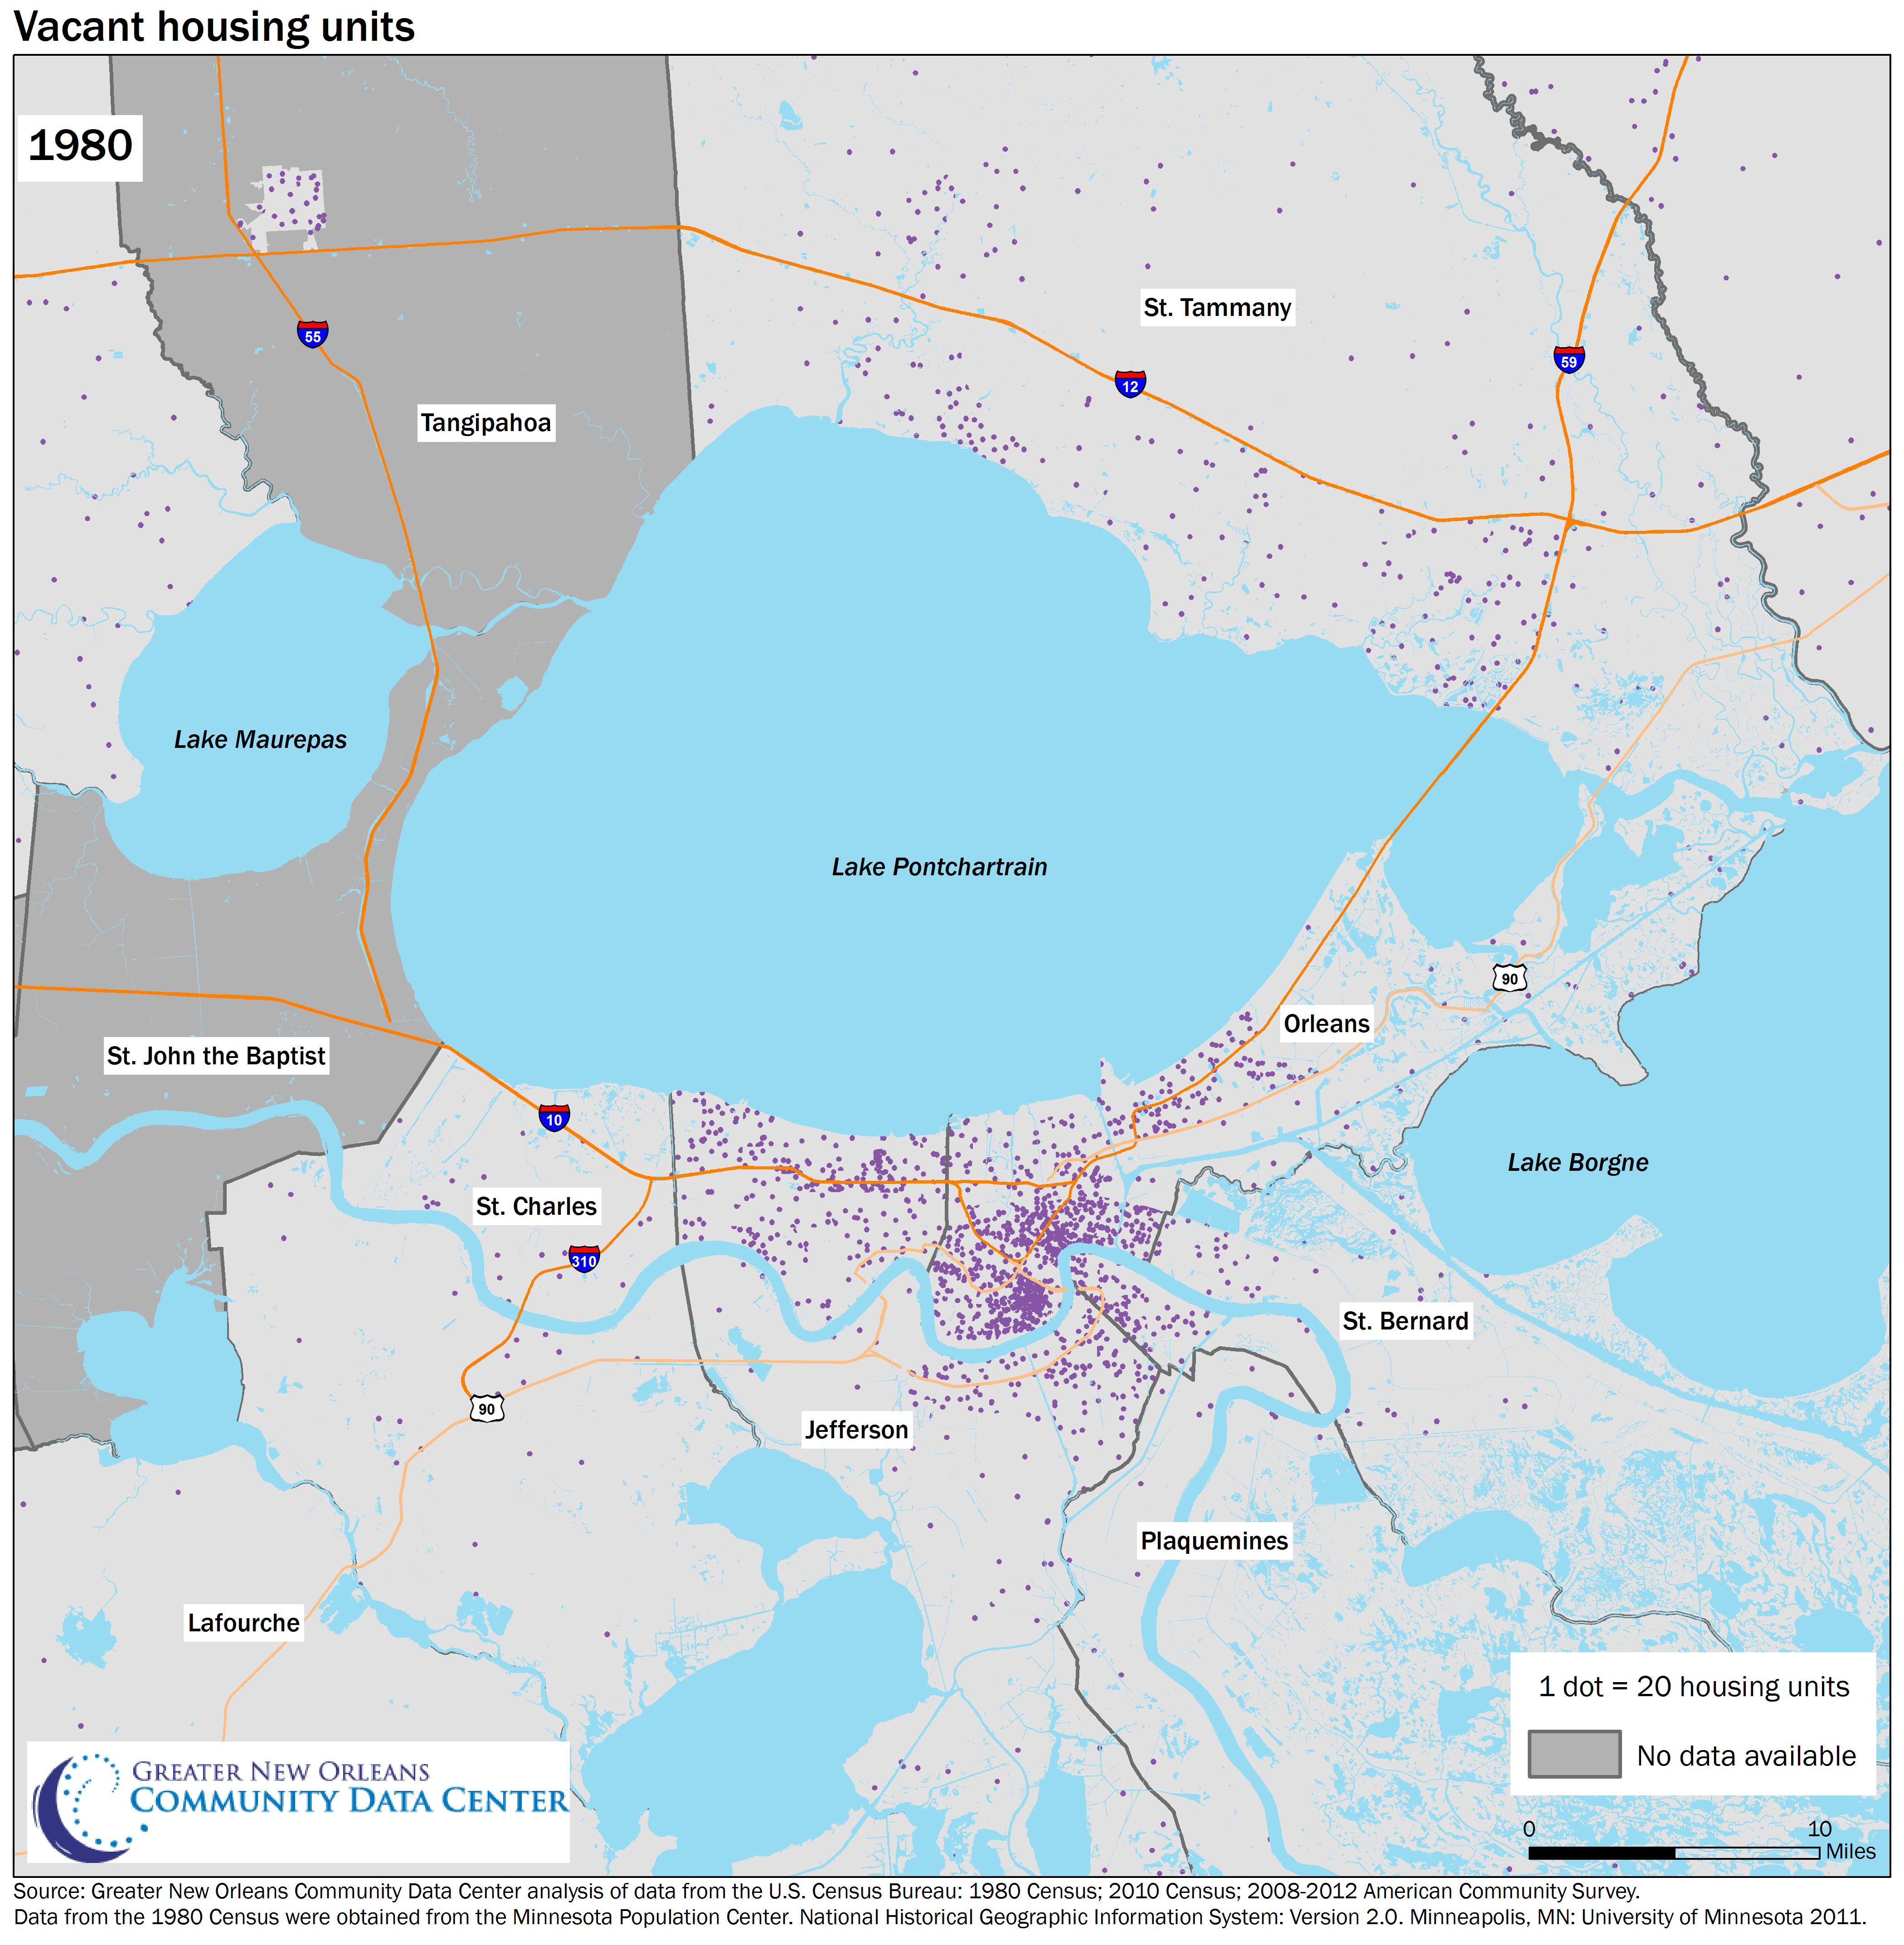
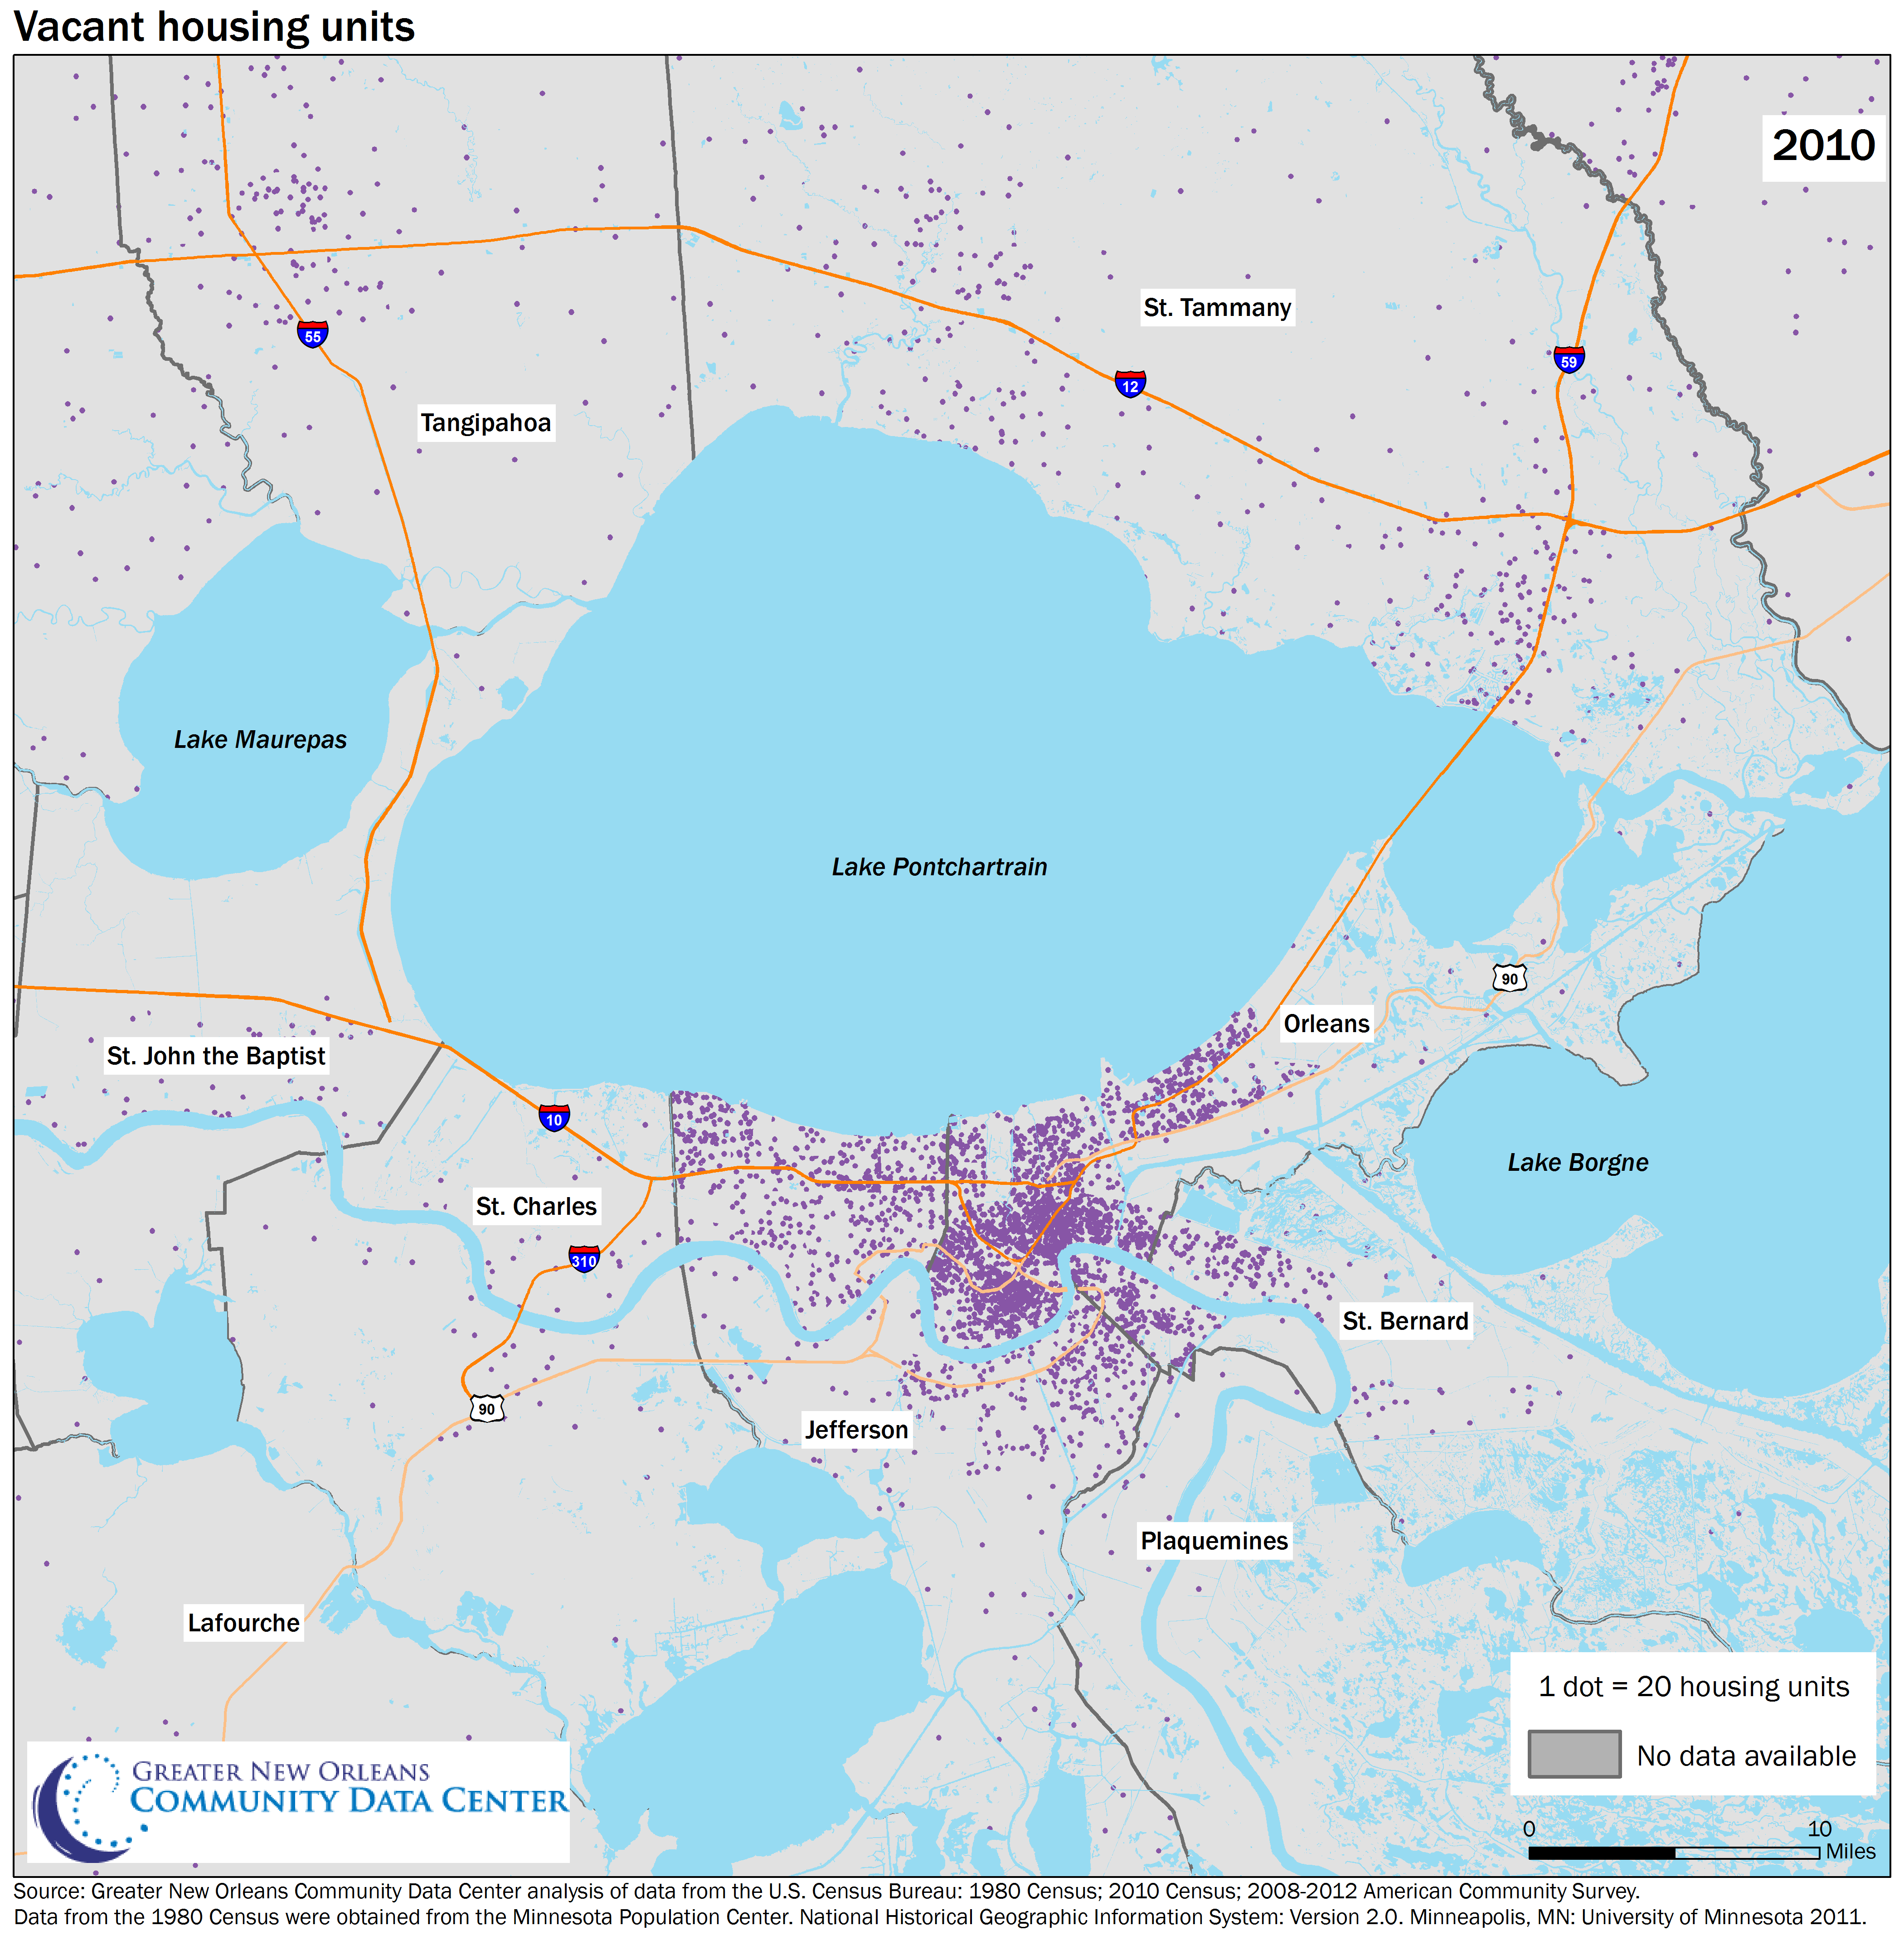
Over the past 40 years, our demographic, economic, and social landscape has changed significantly. Through the oil bust of the 1980’s to Hurricane Katrina and the levee failures, we have seen our population age, spread out, become more diverse, and more educated. At the same time, the number of poor people in the suburbs now outnumbers those in the city, and vacant housing has increased in the city as development spread across the New Orleans region. To show the profound changes that have occurred in our region, The Data Center has created a web visualization that compares the region in 1980 and today.
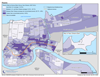
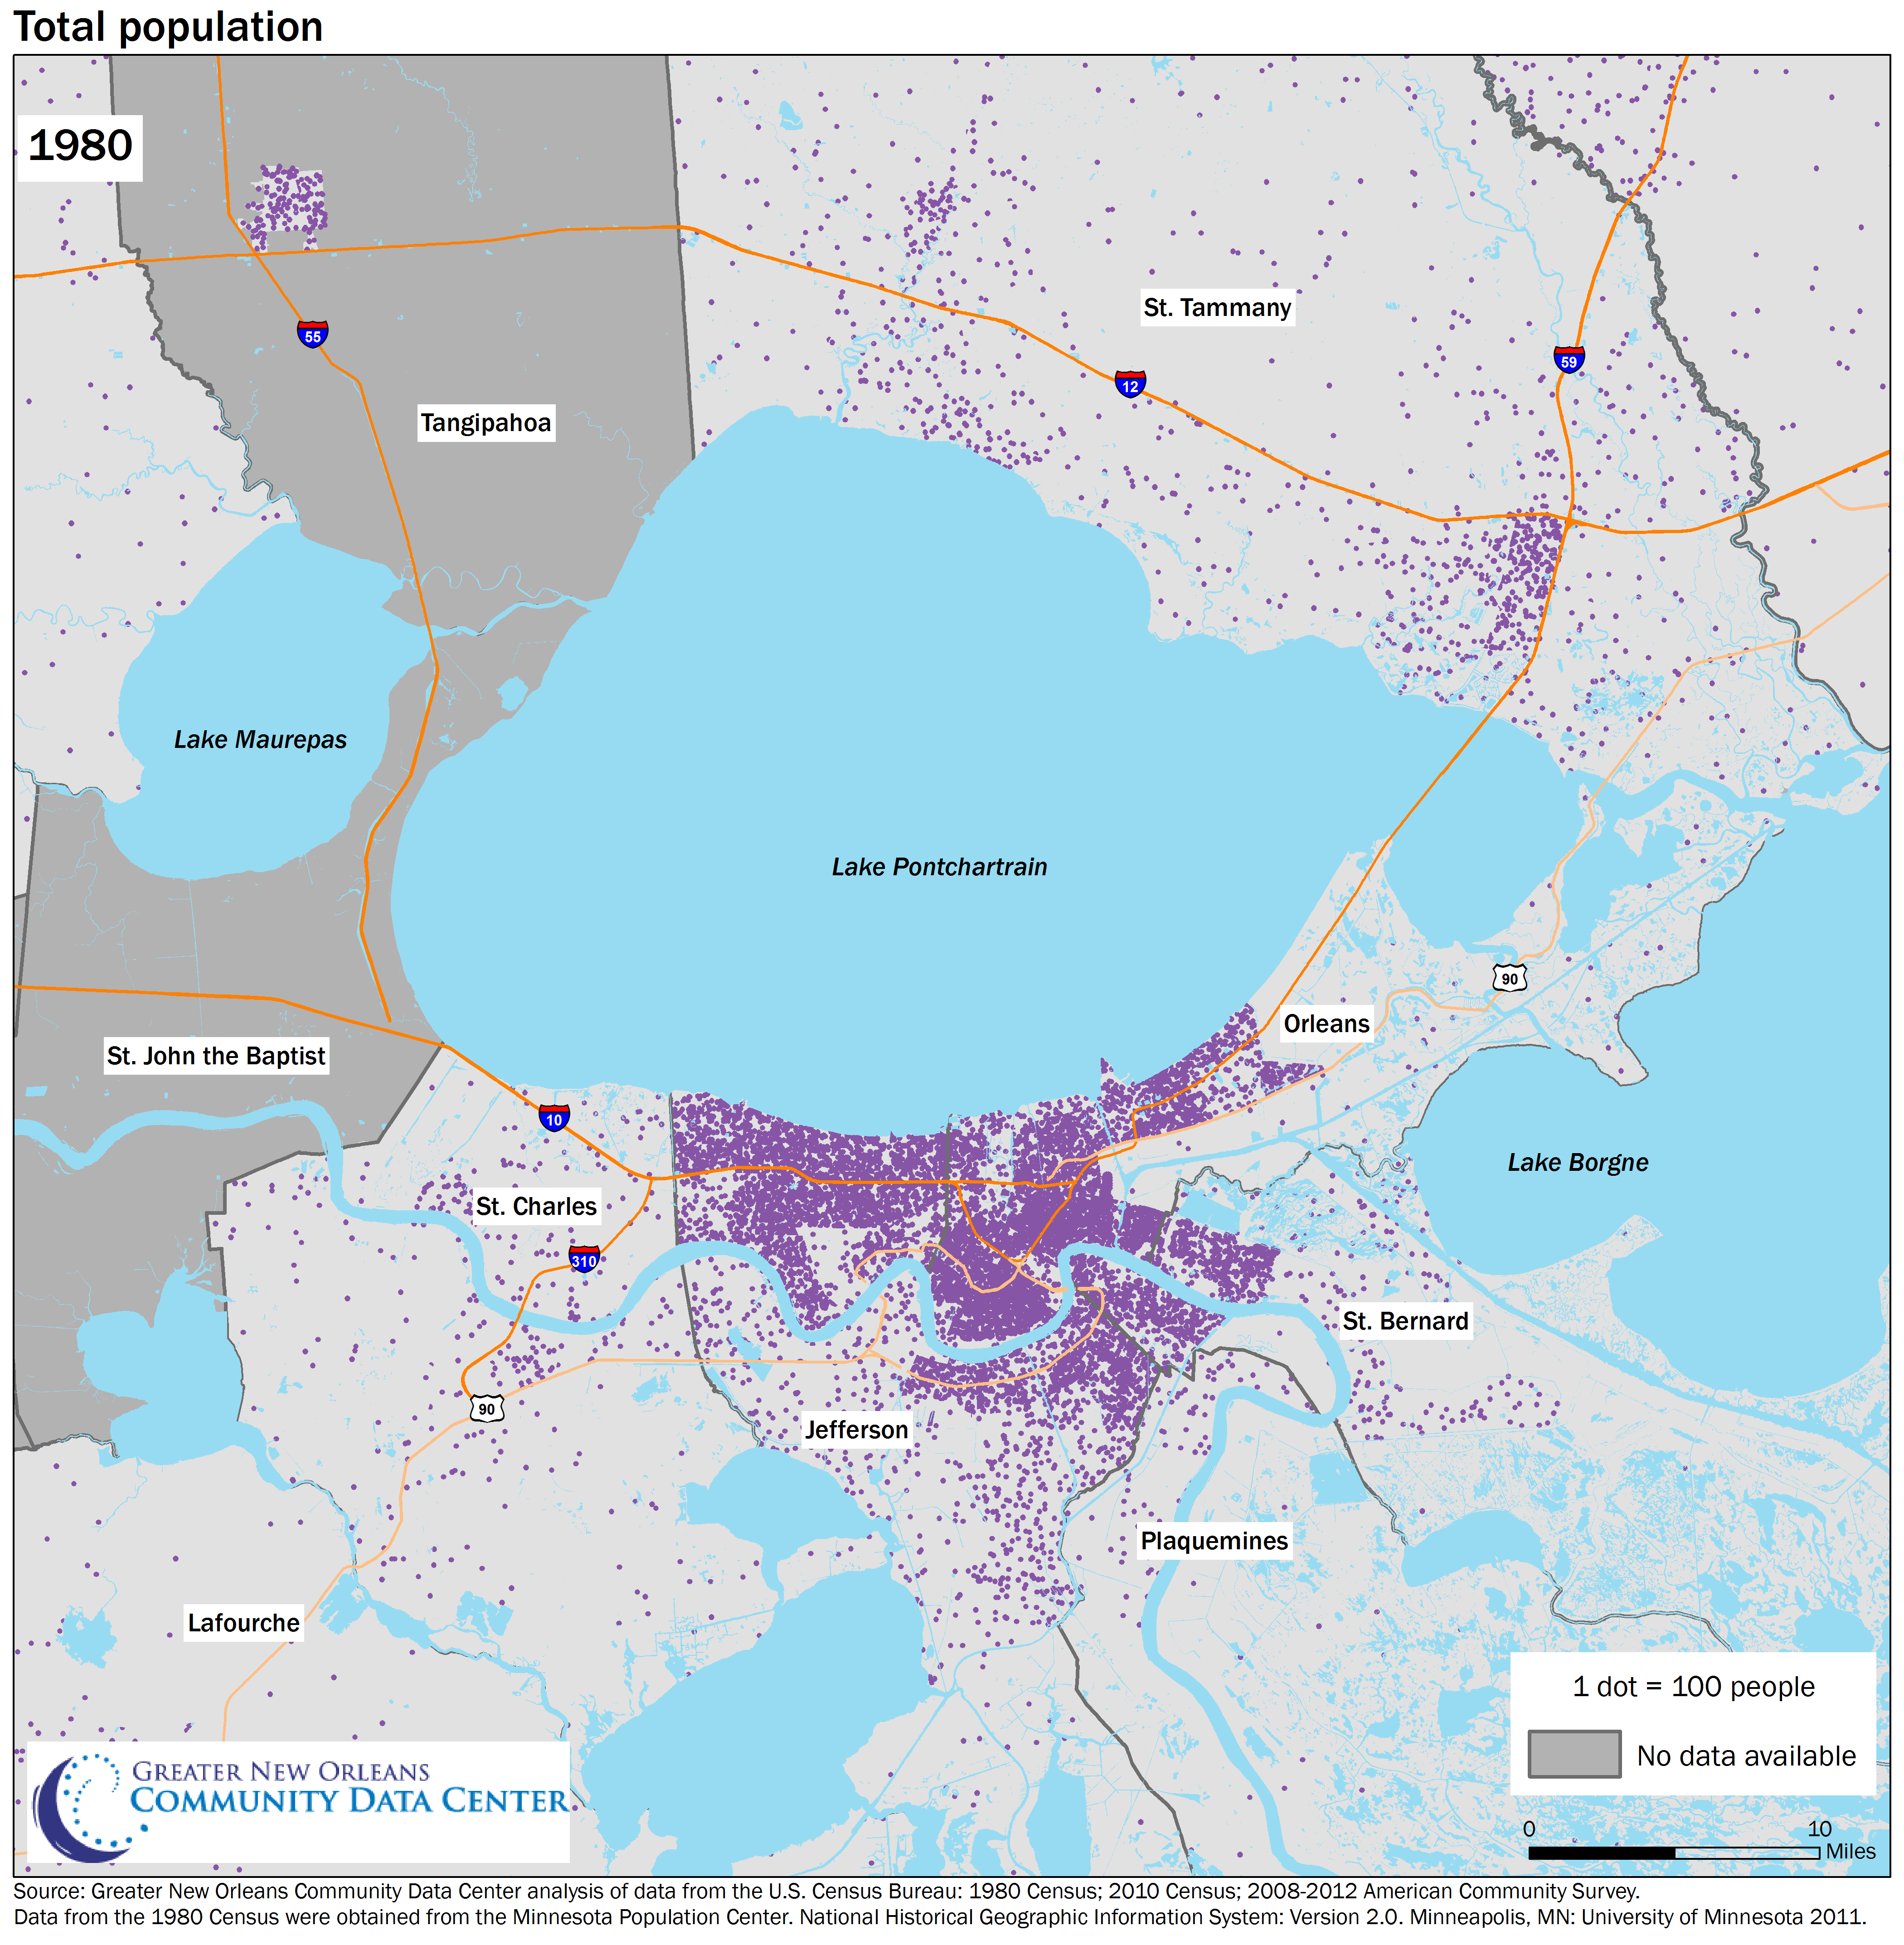
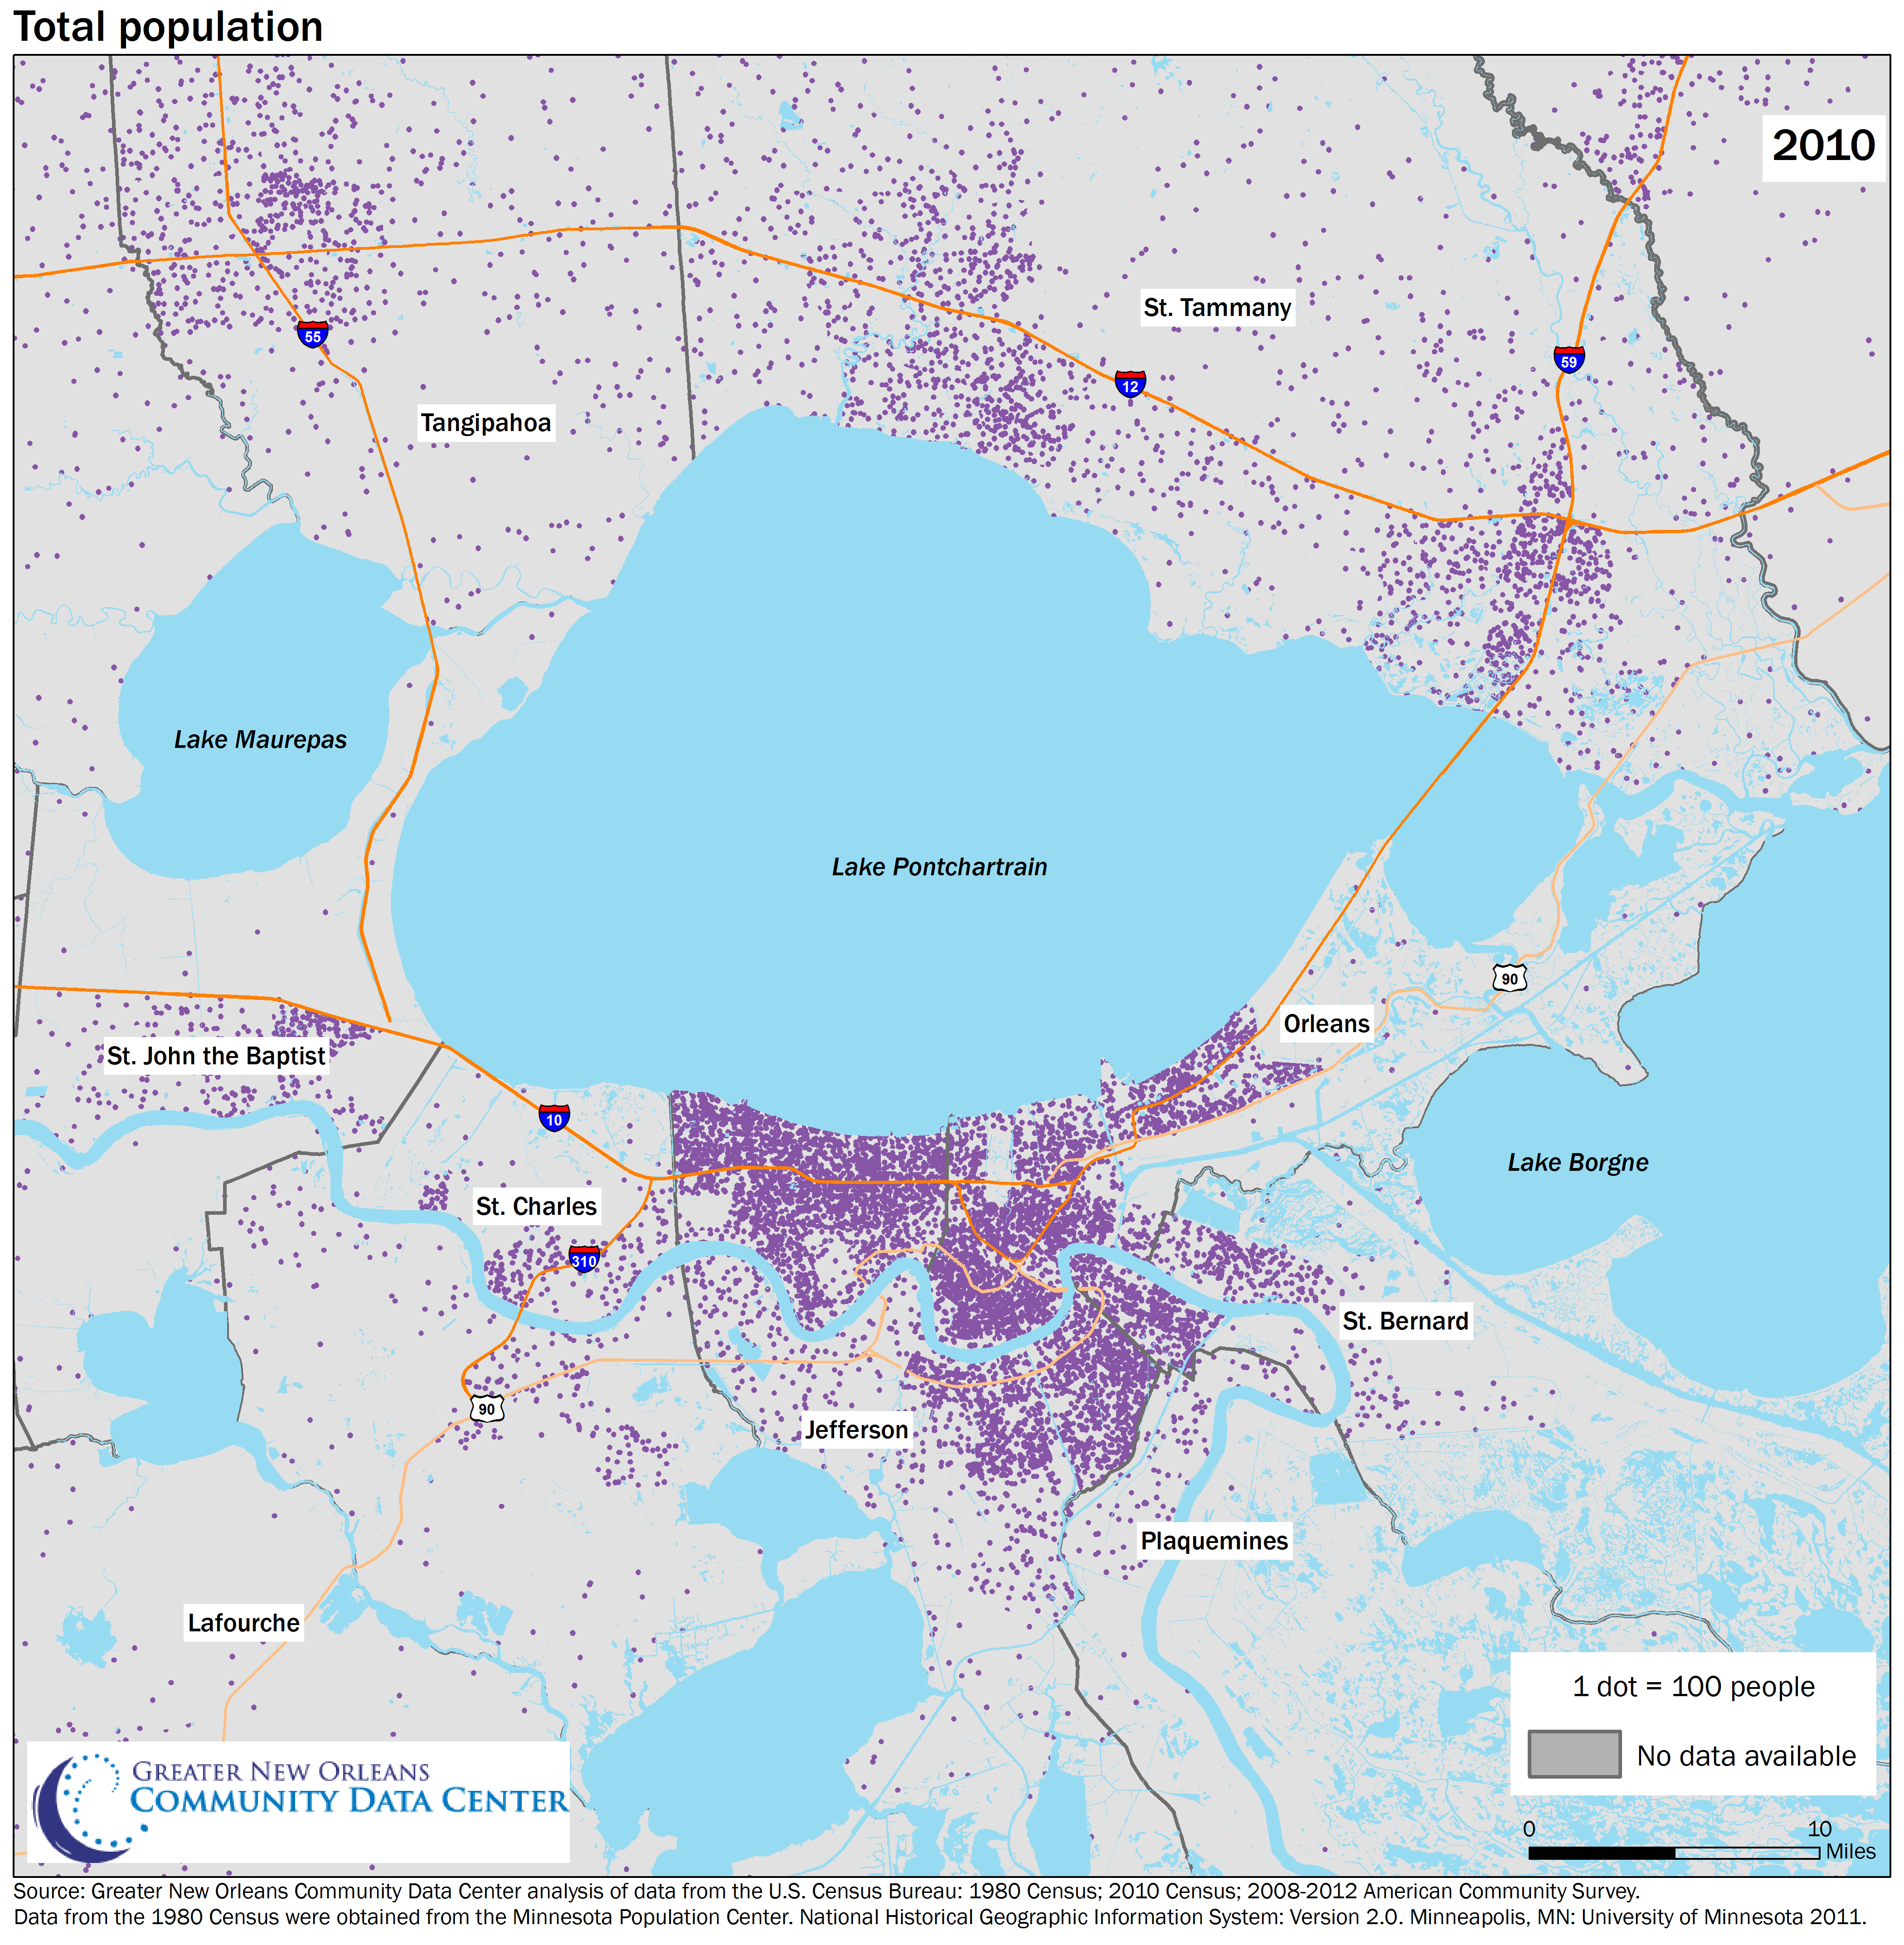
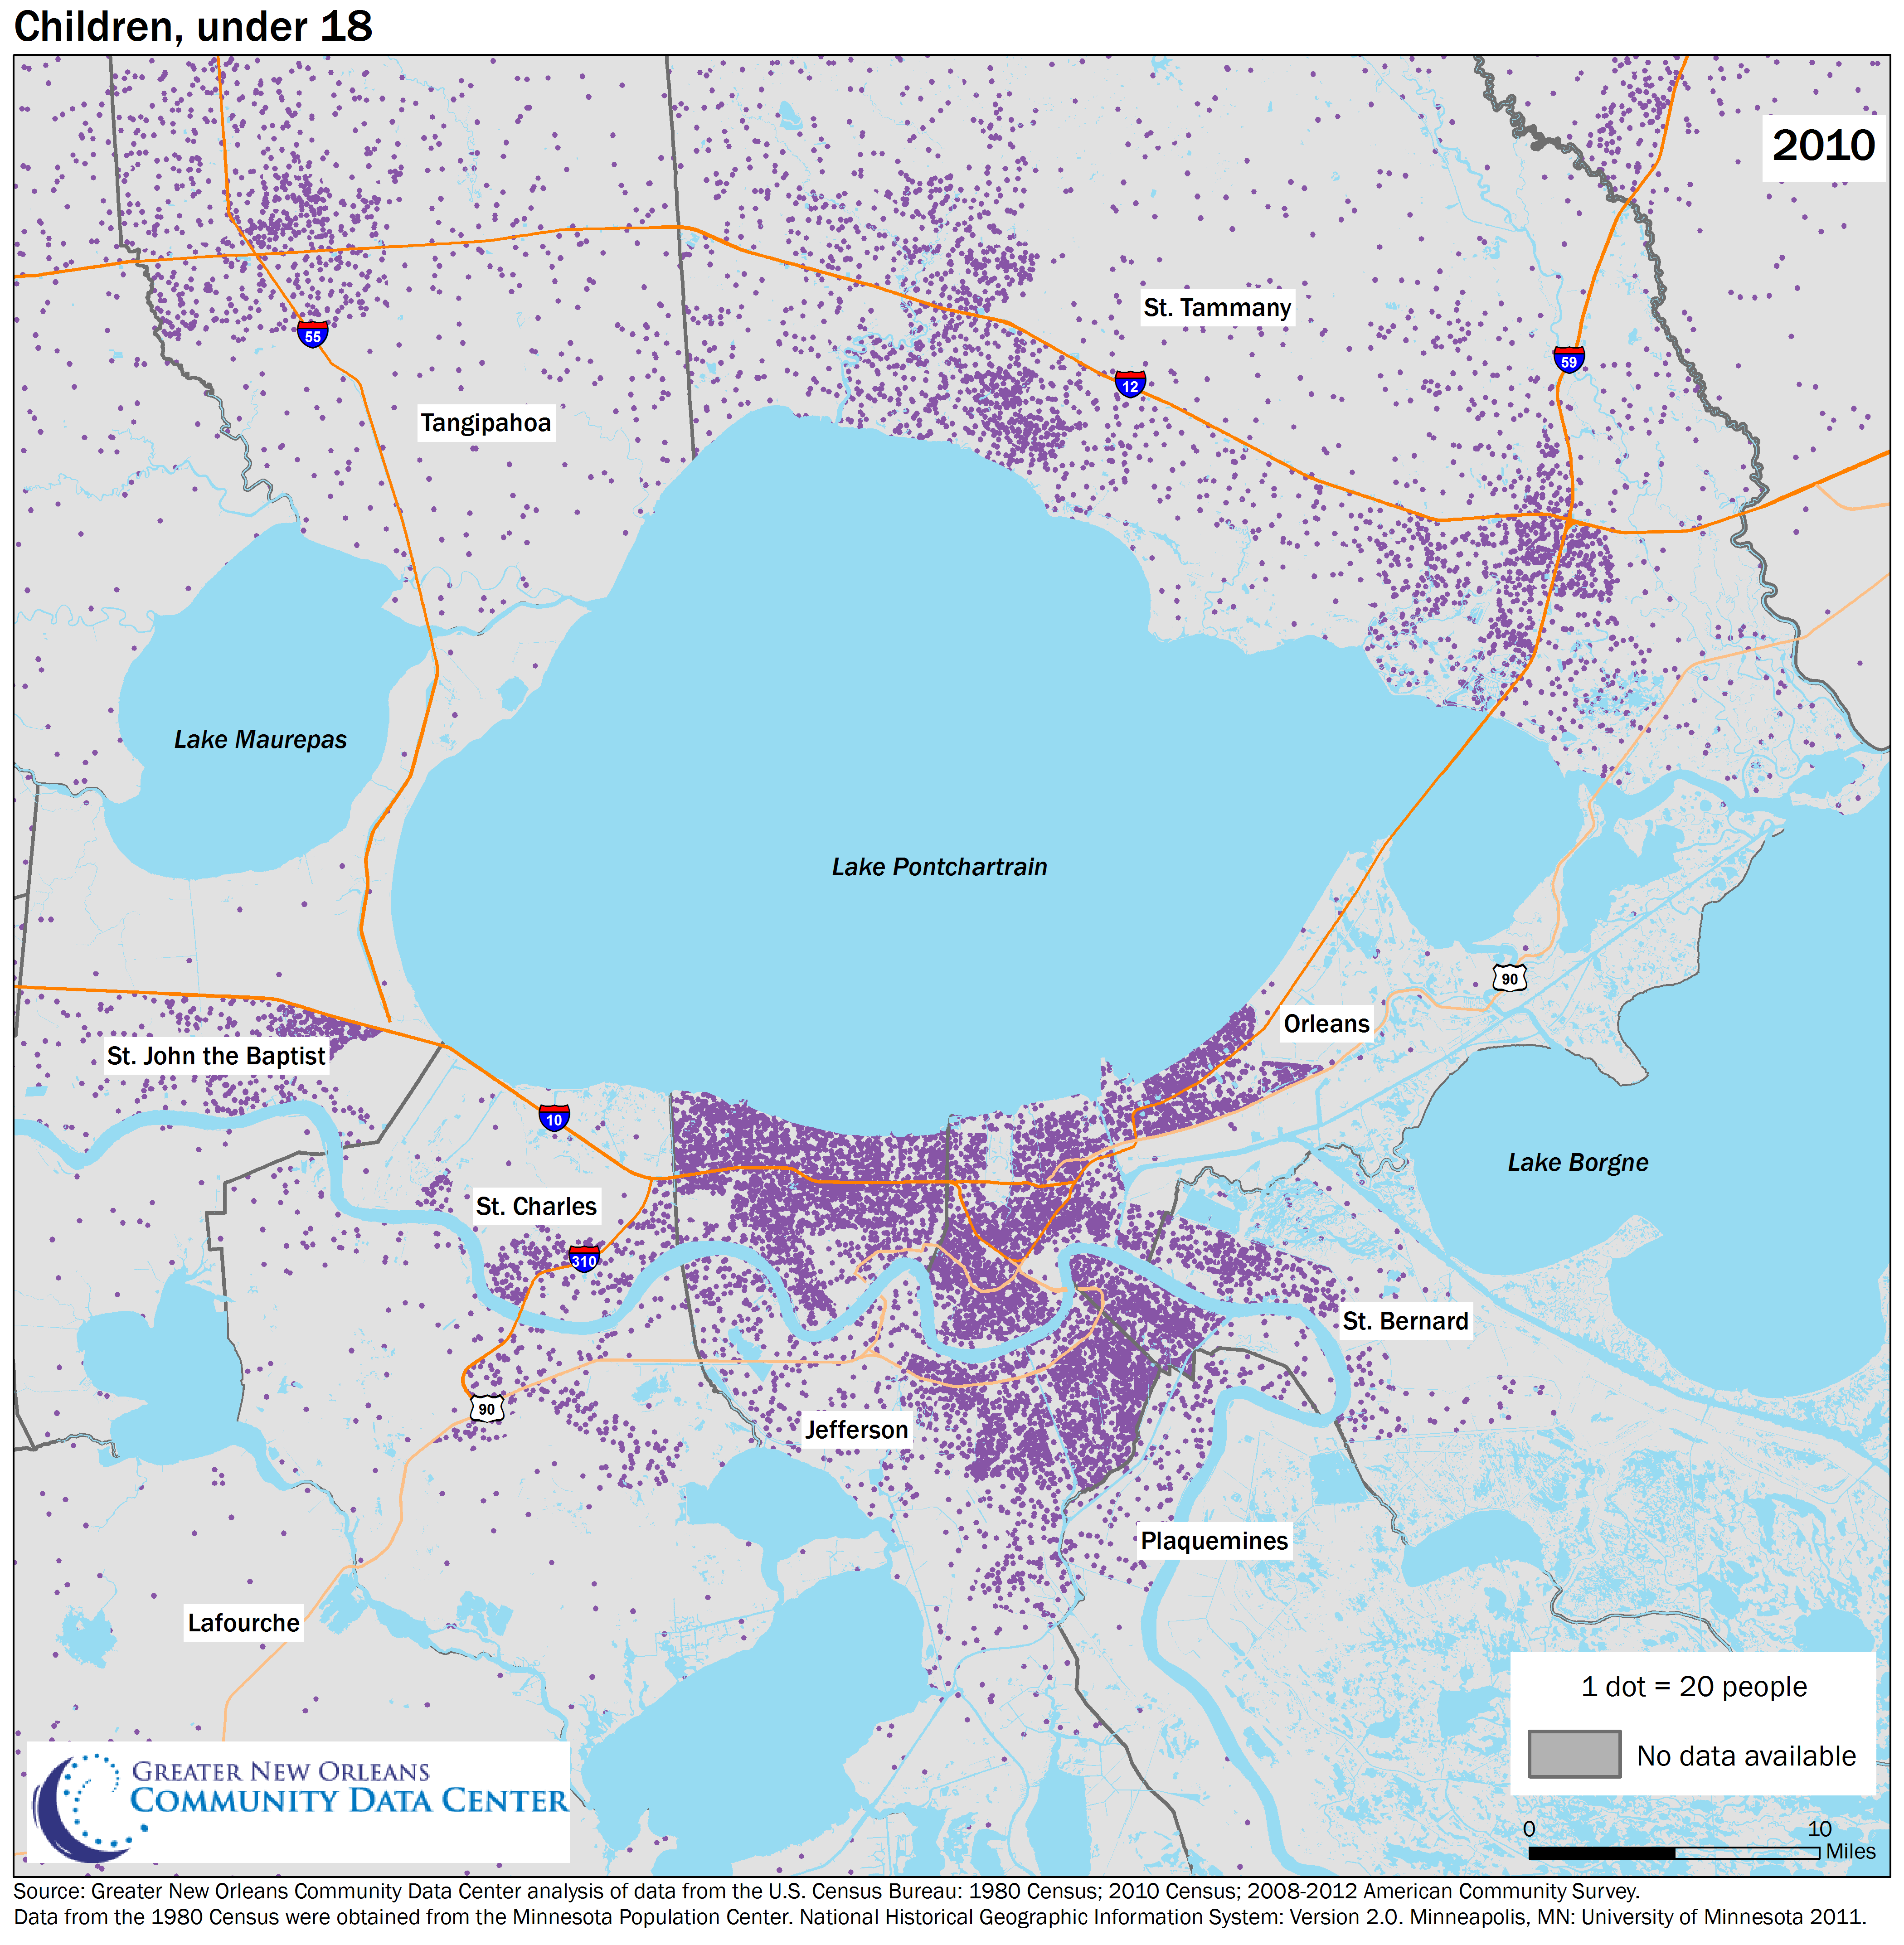
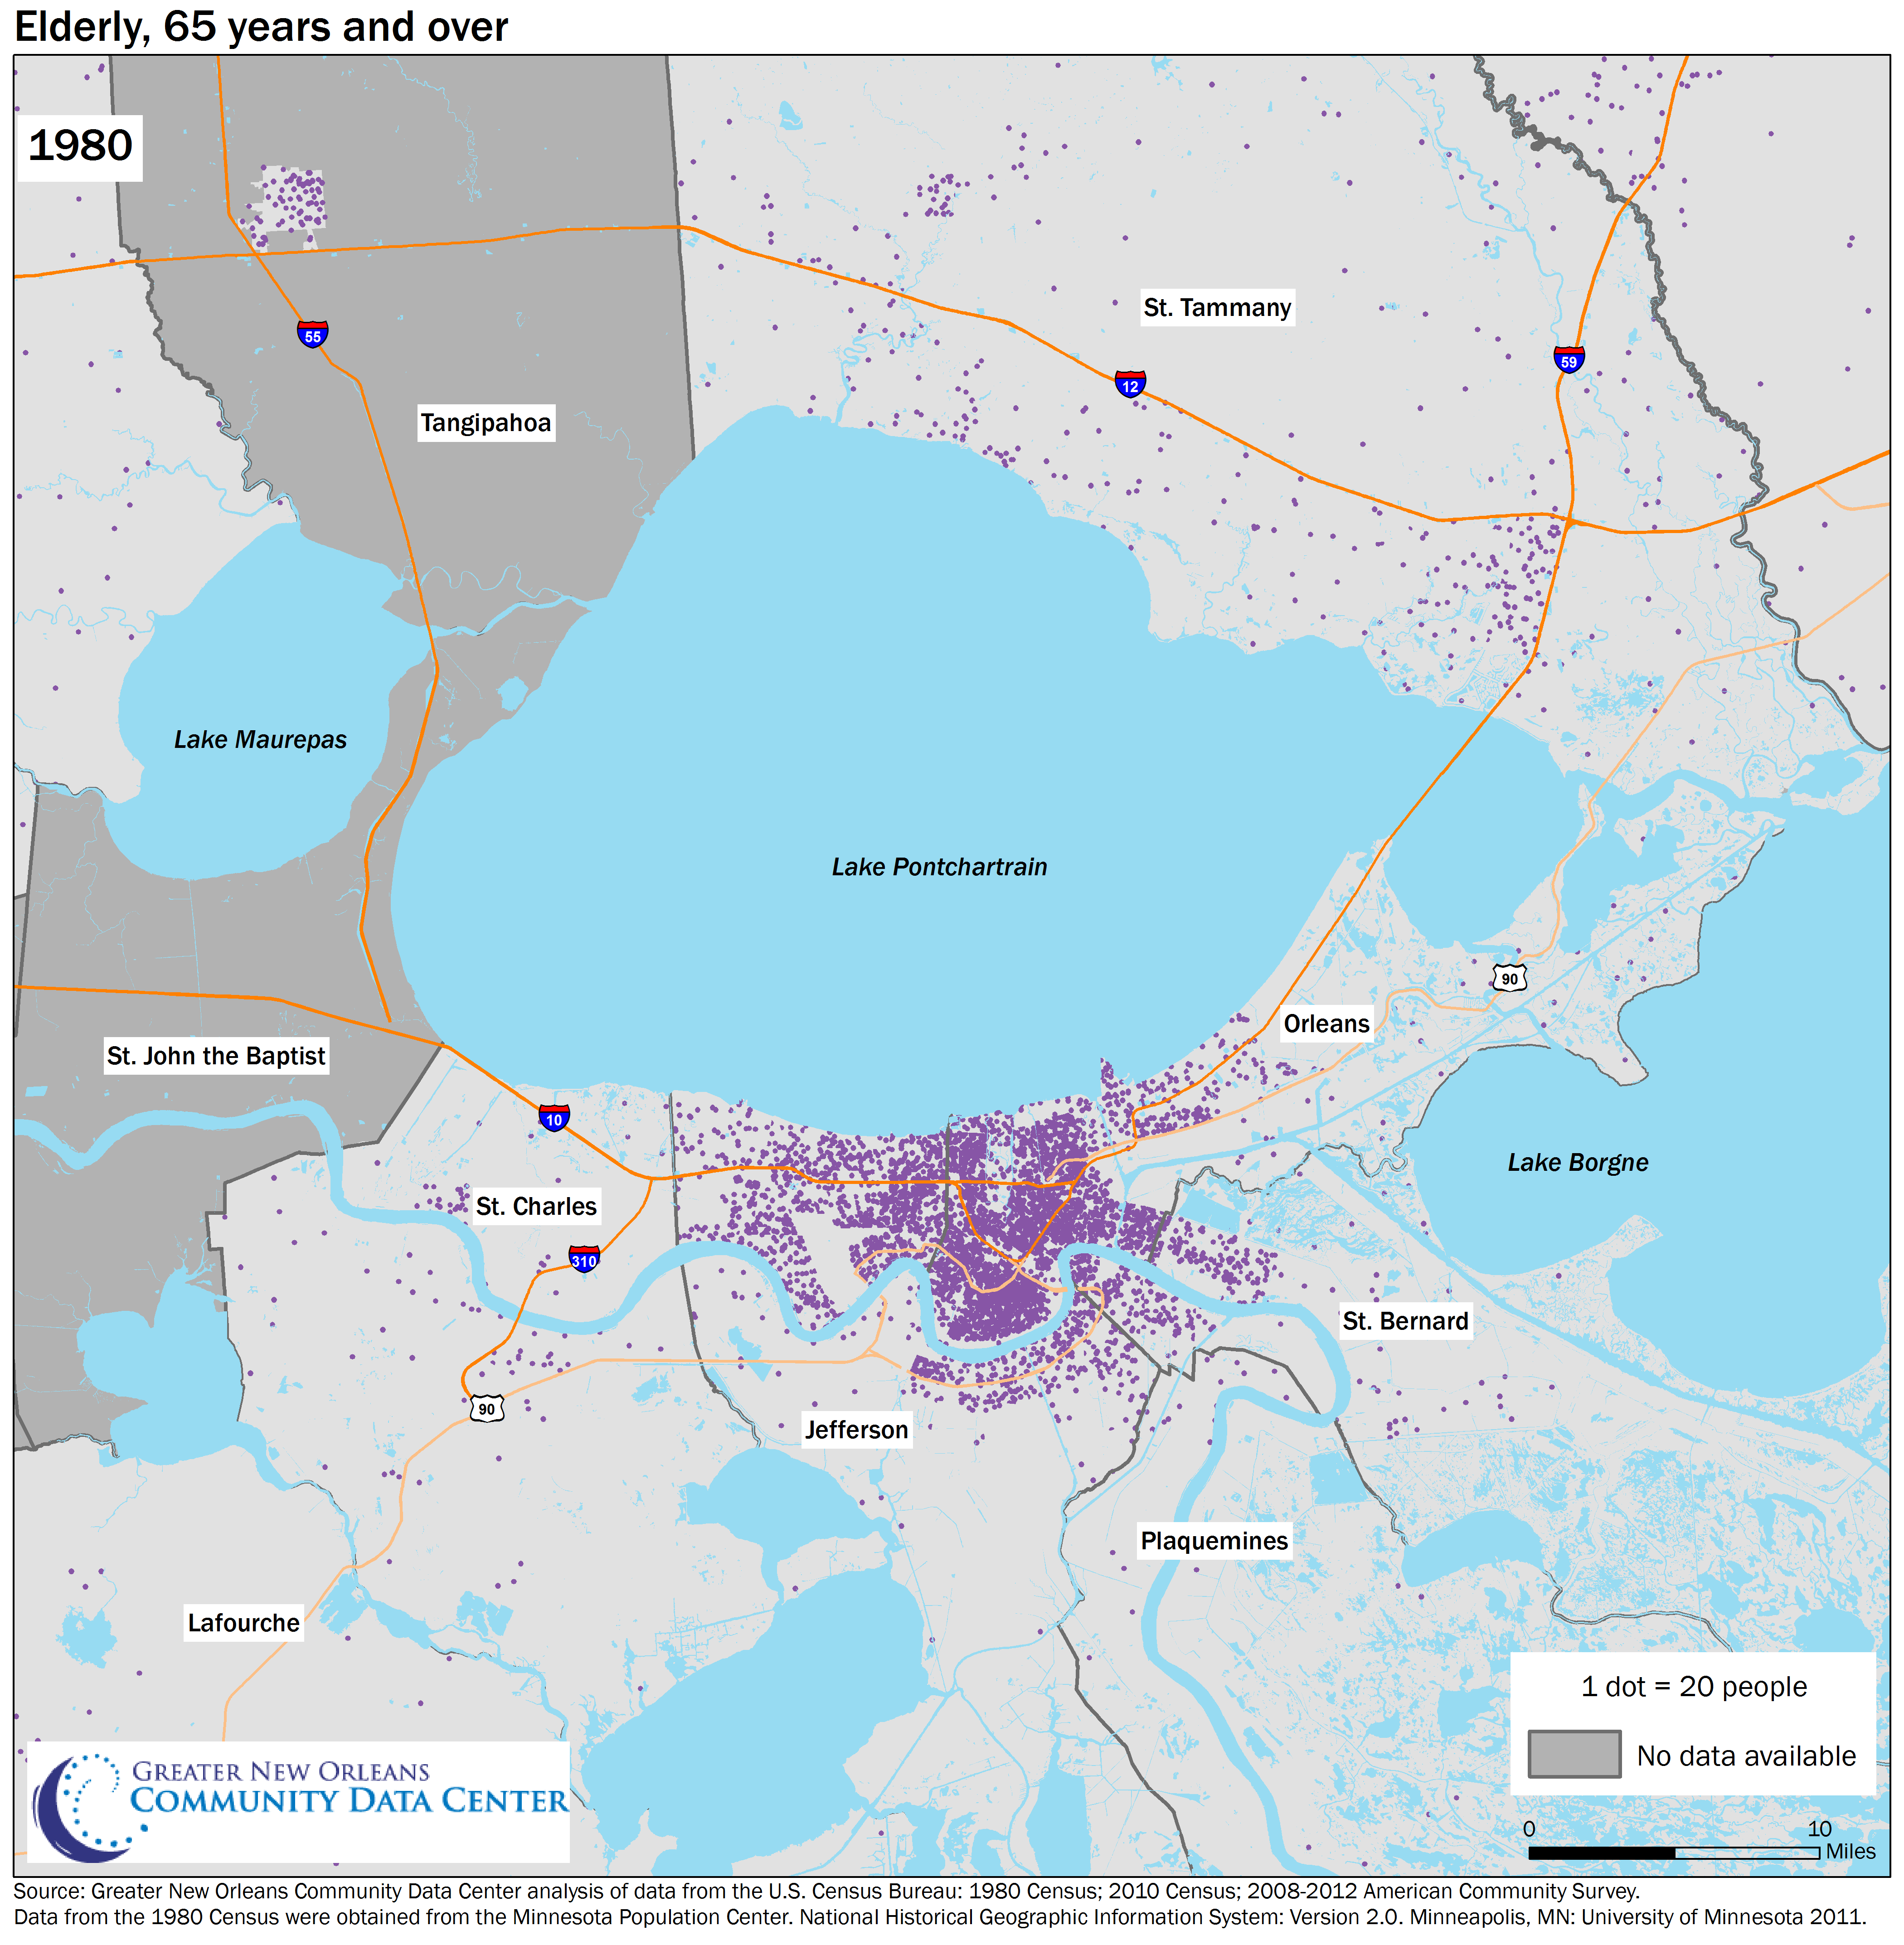
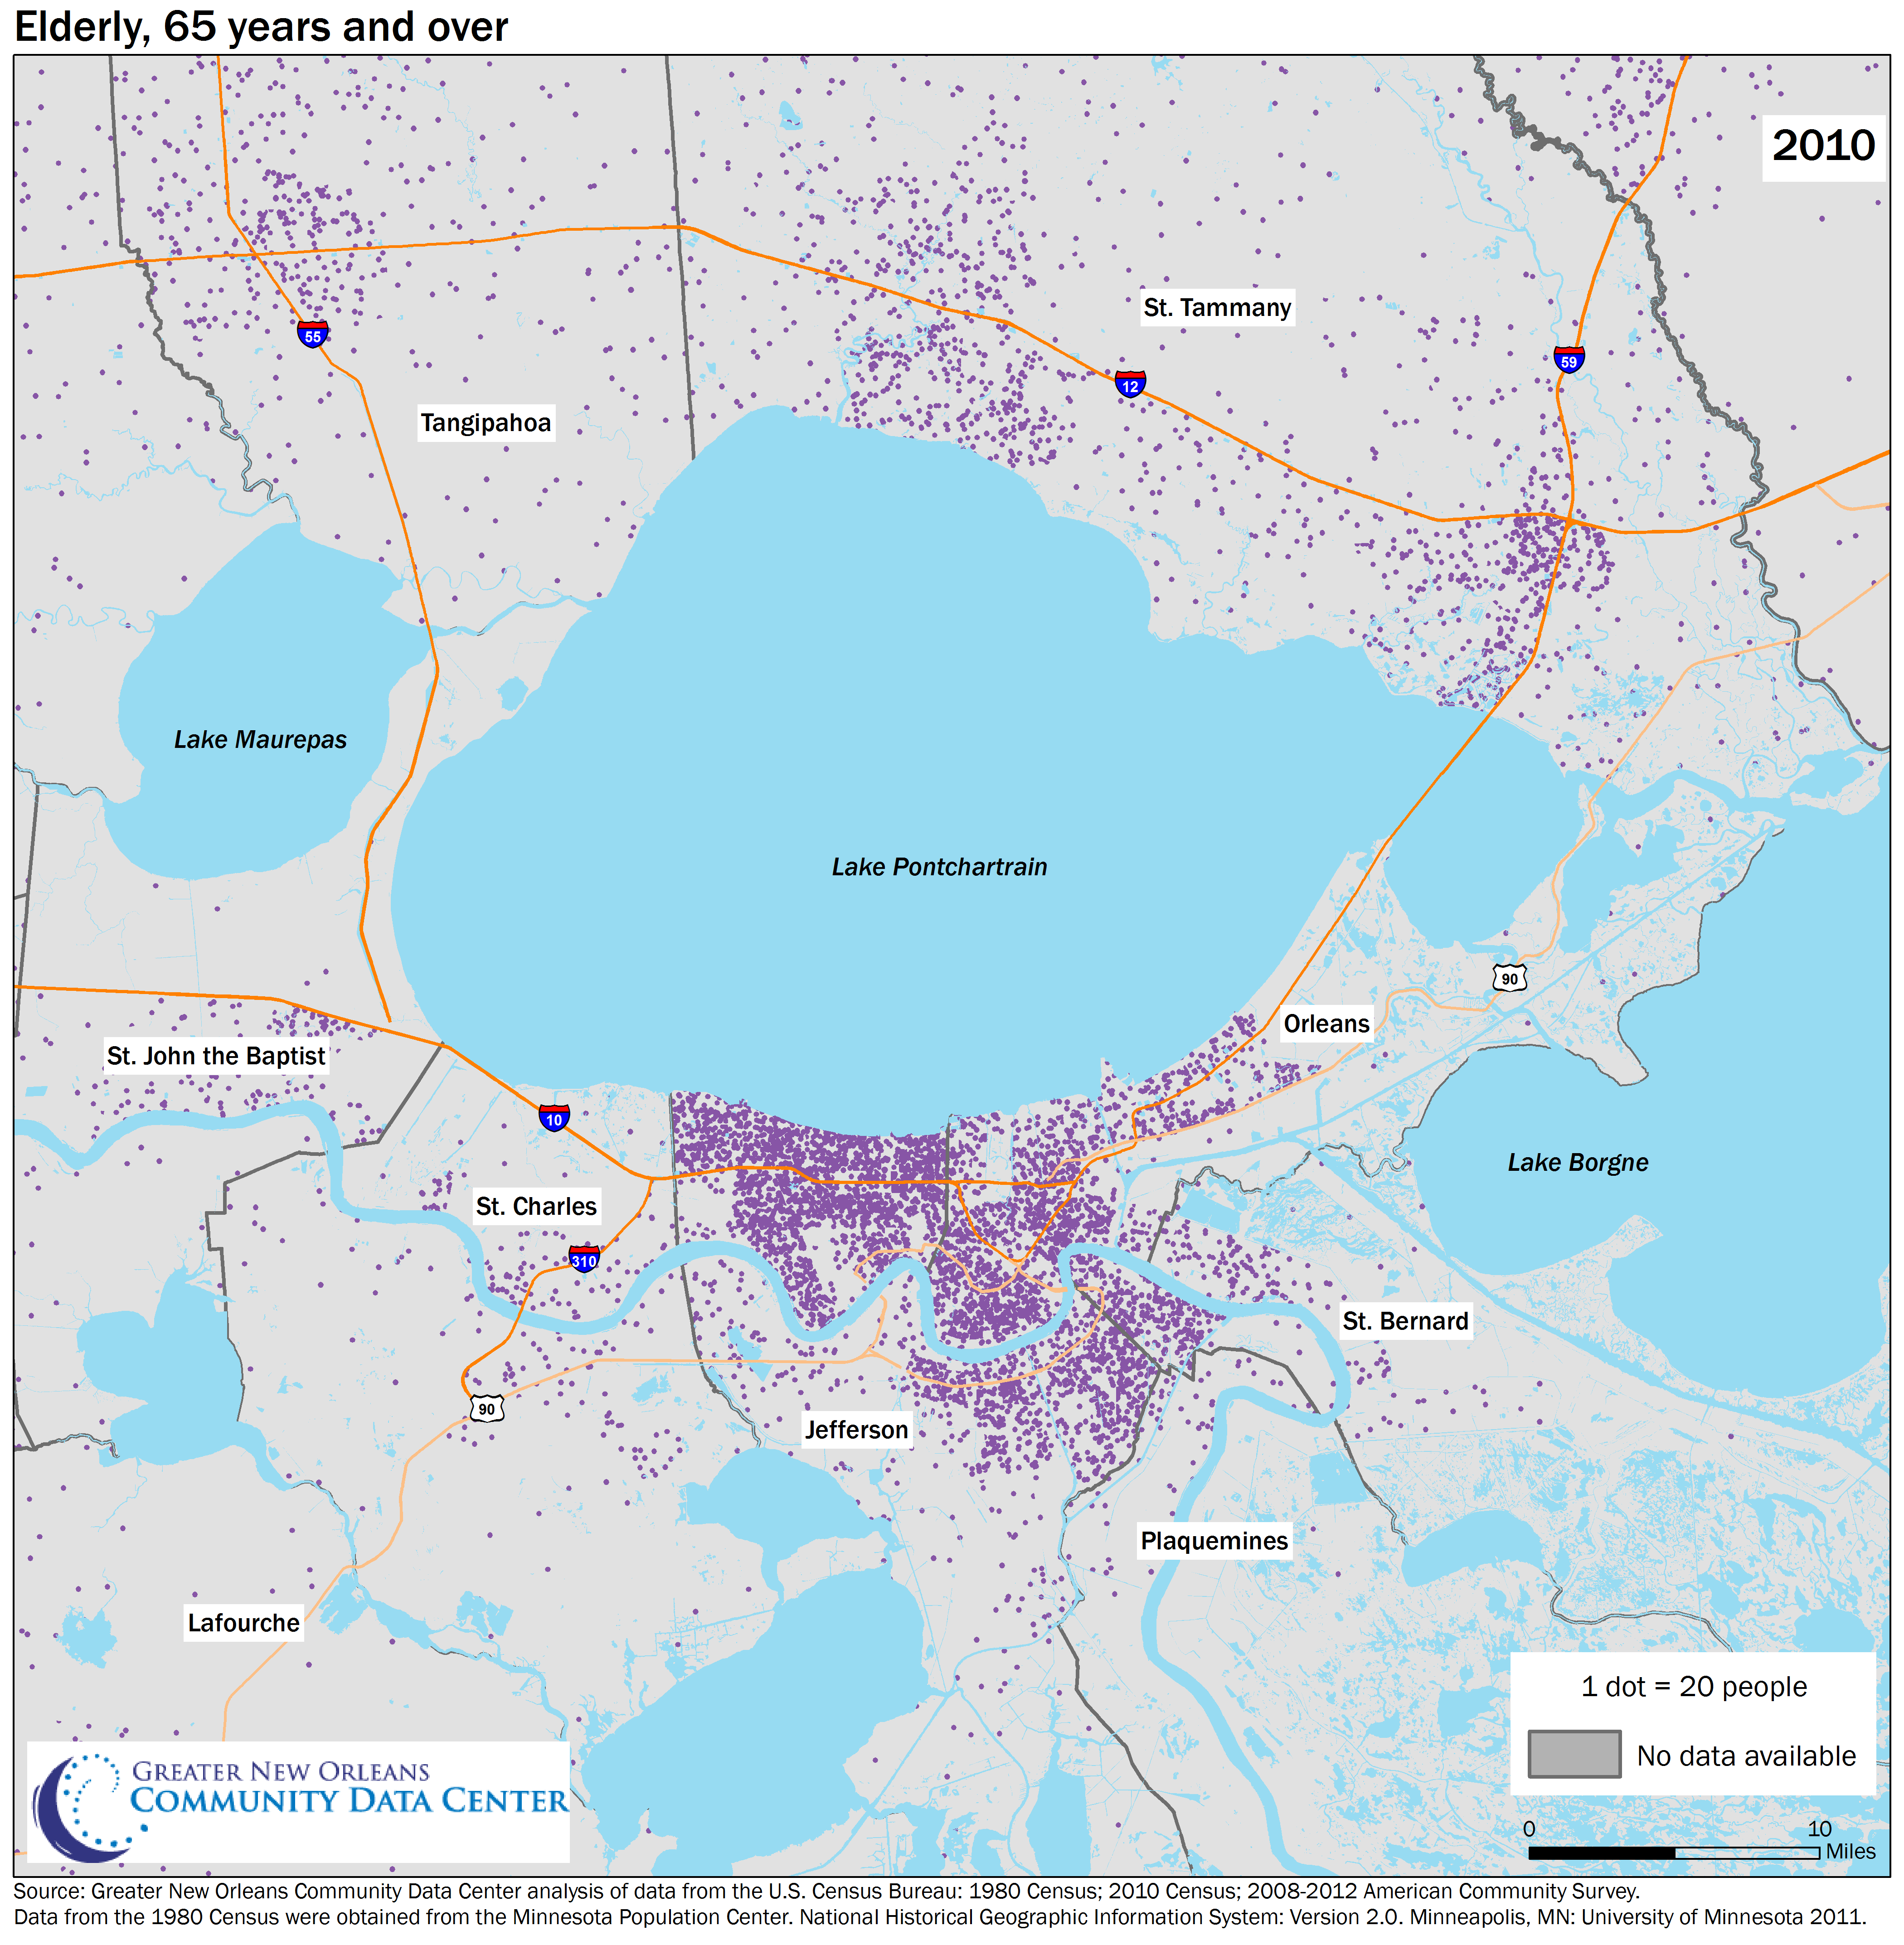
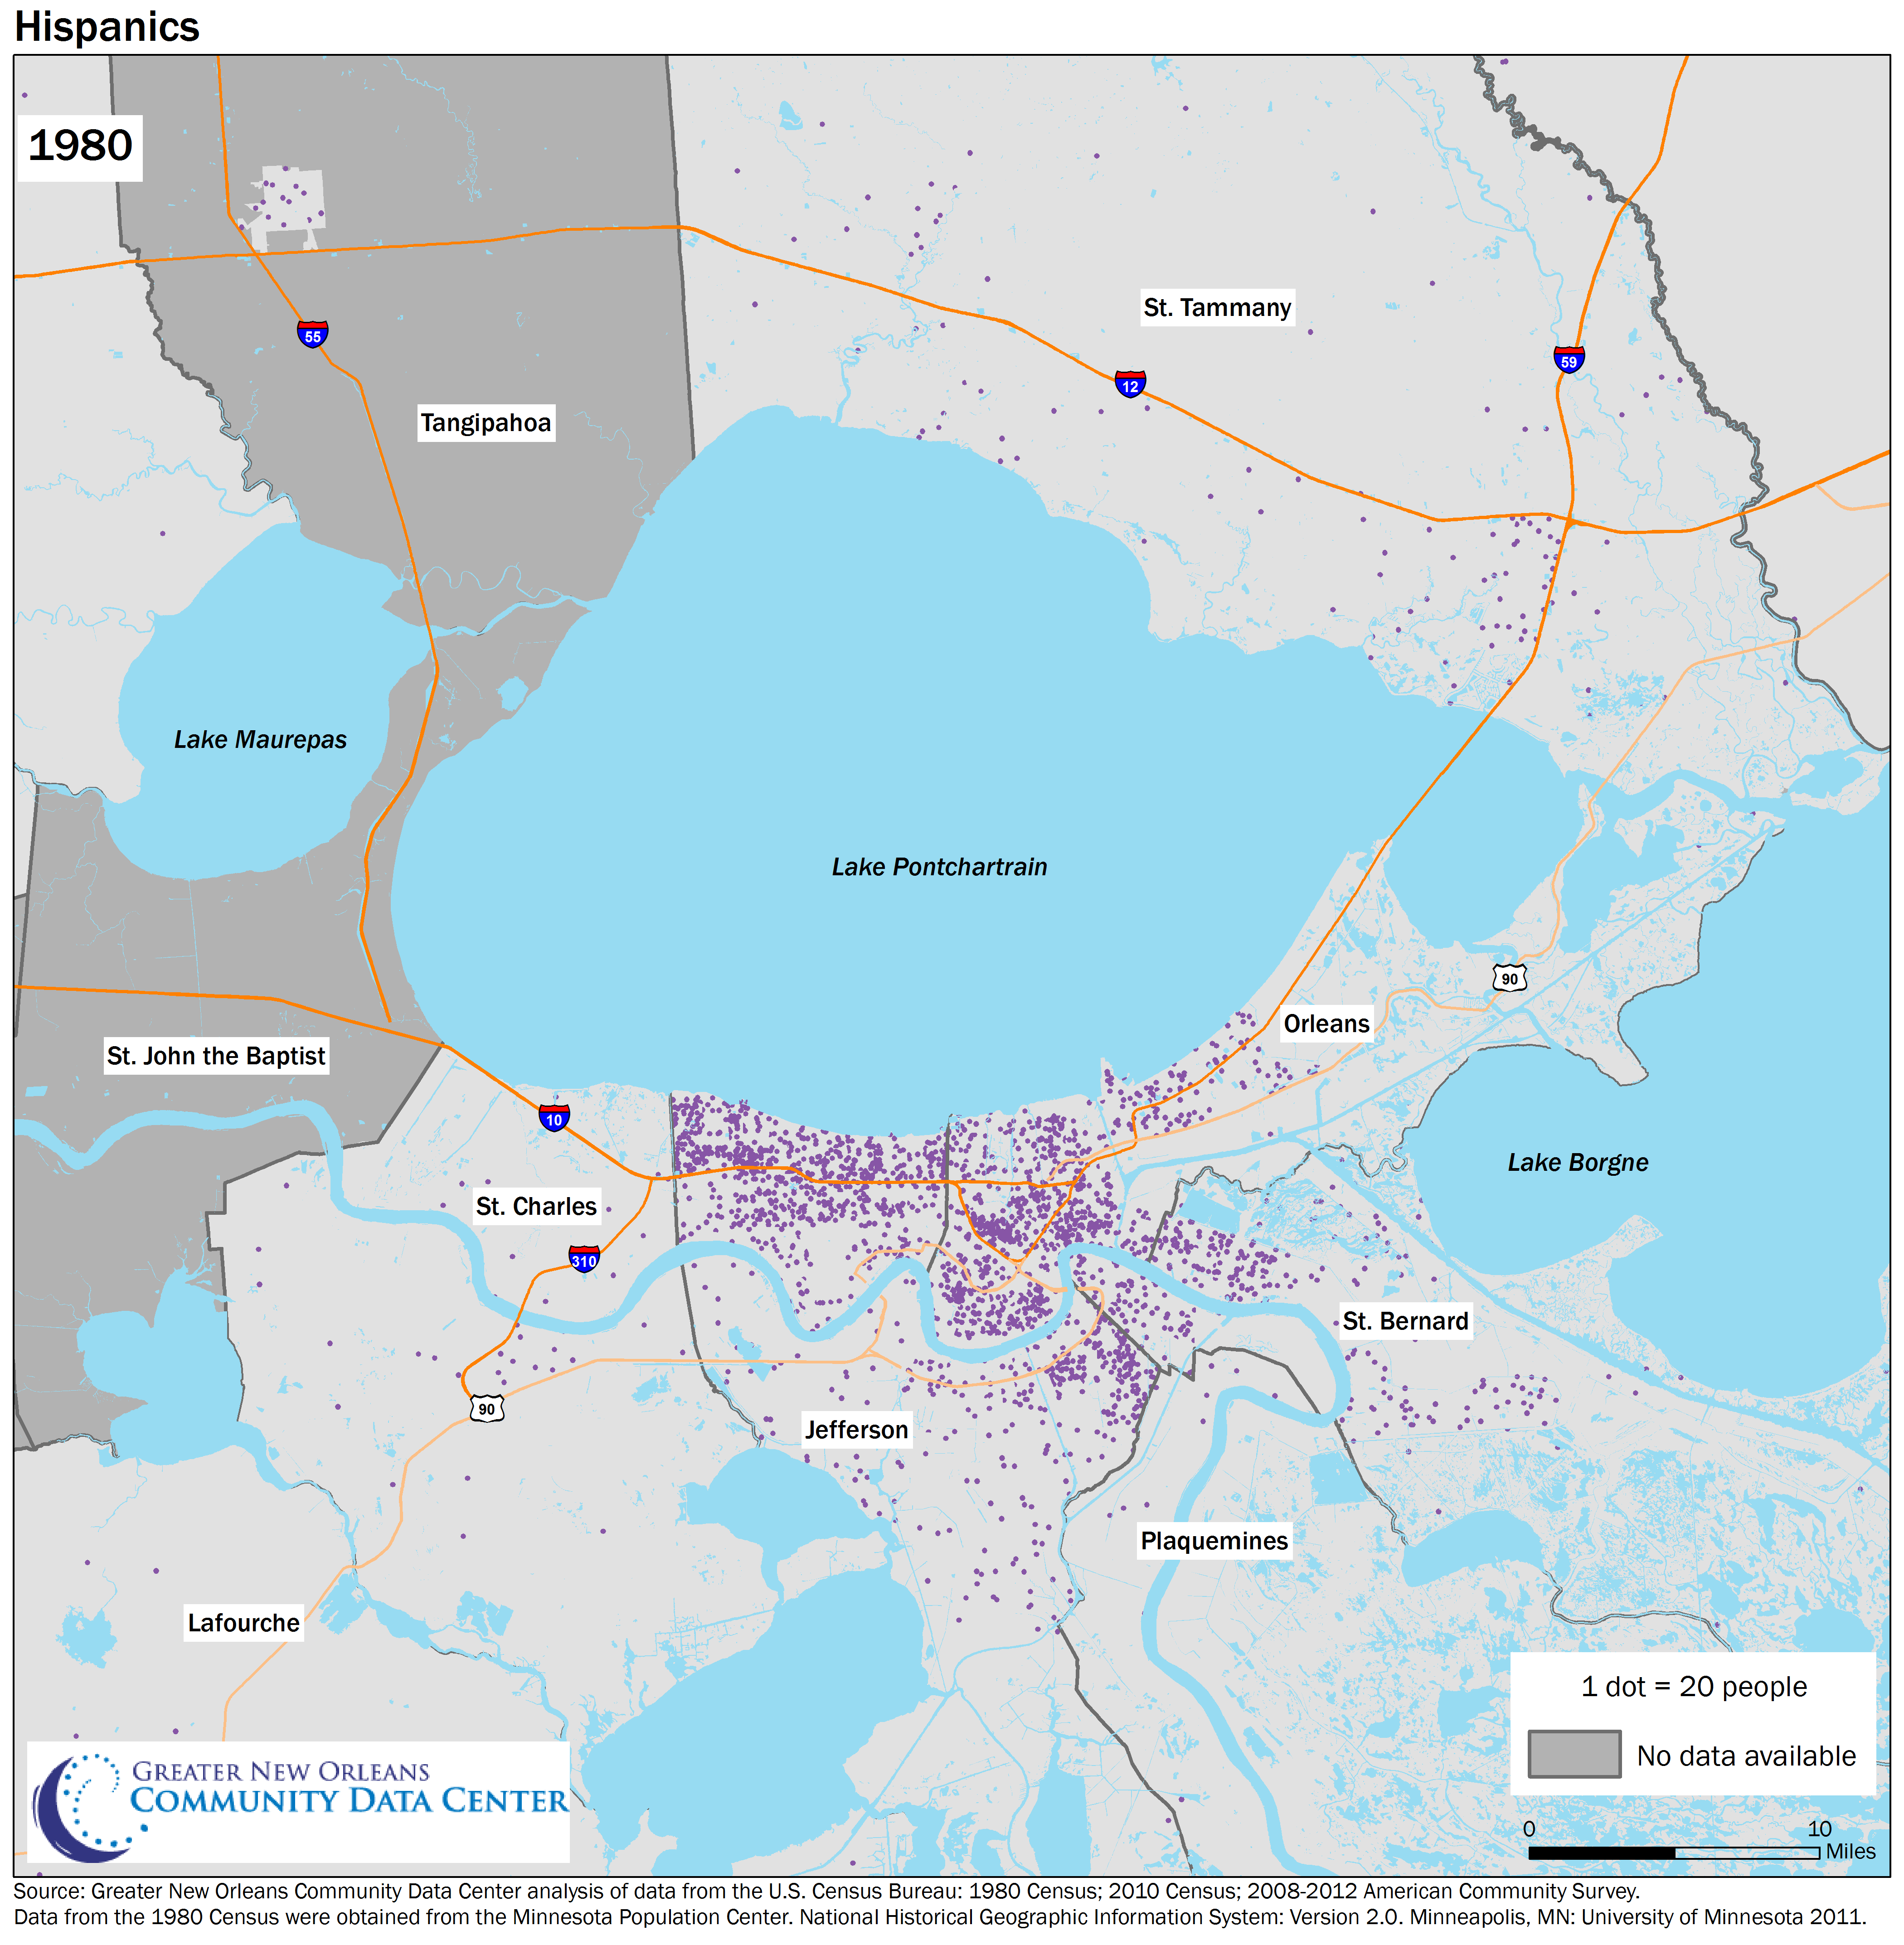
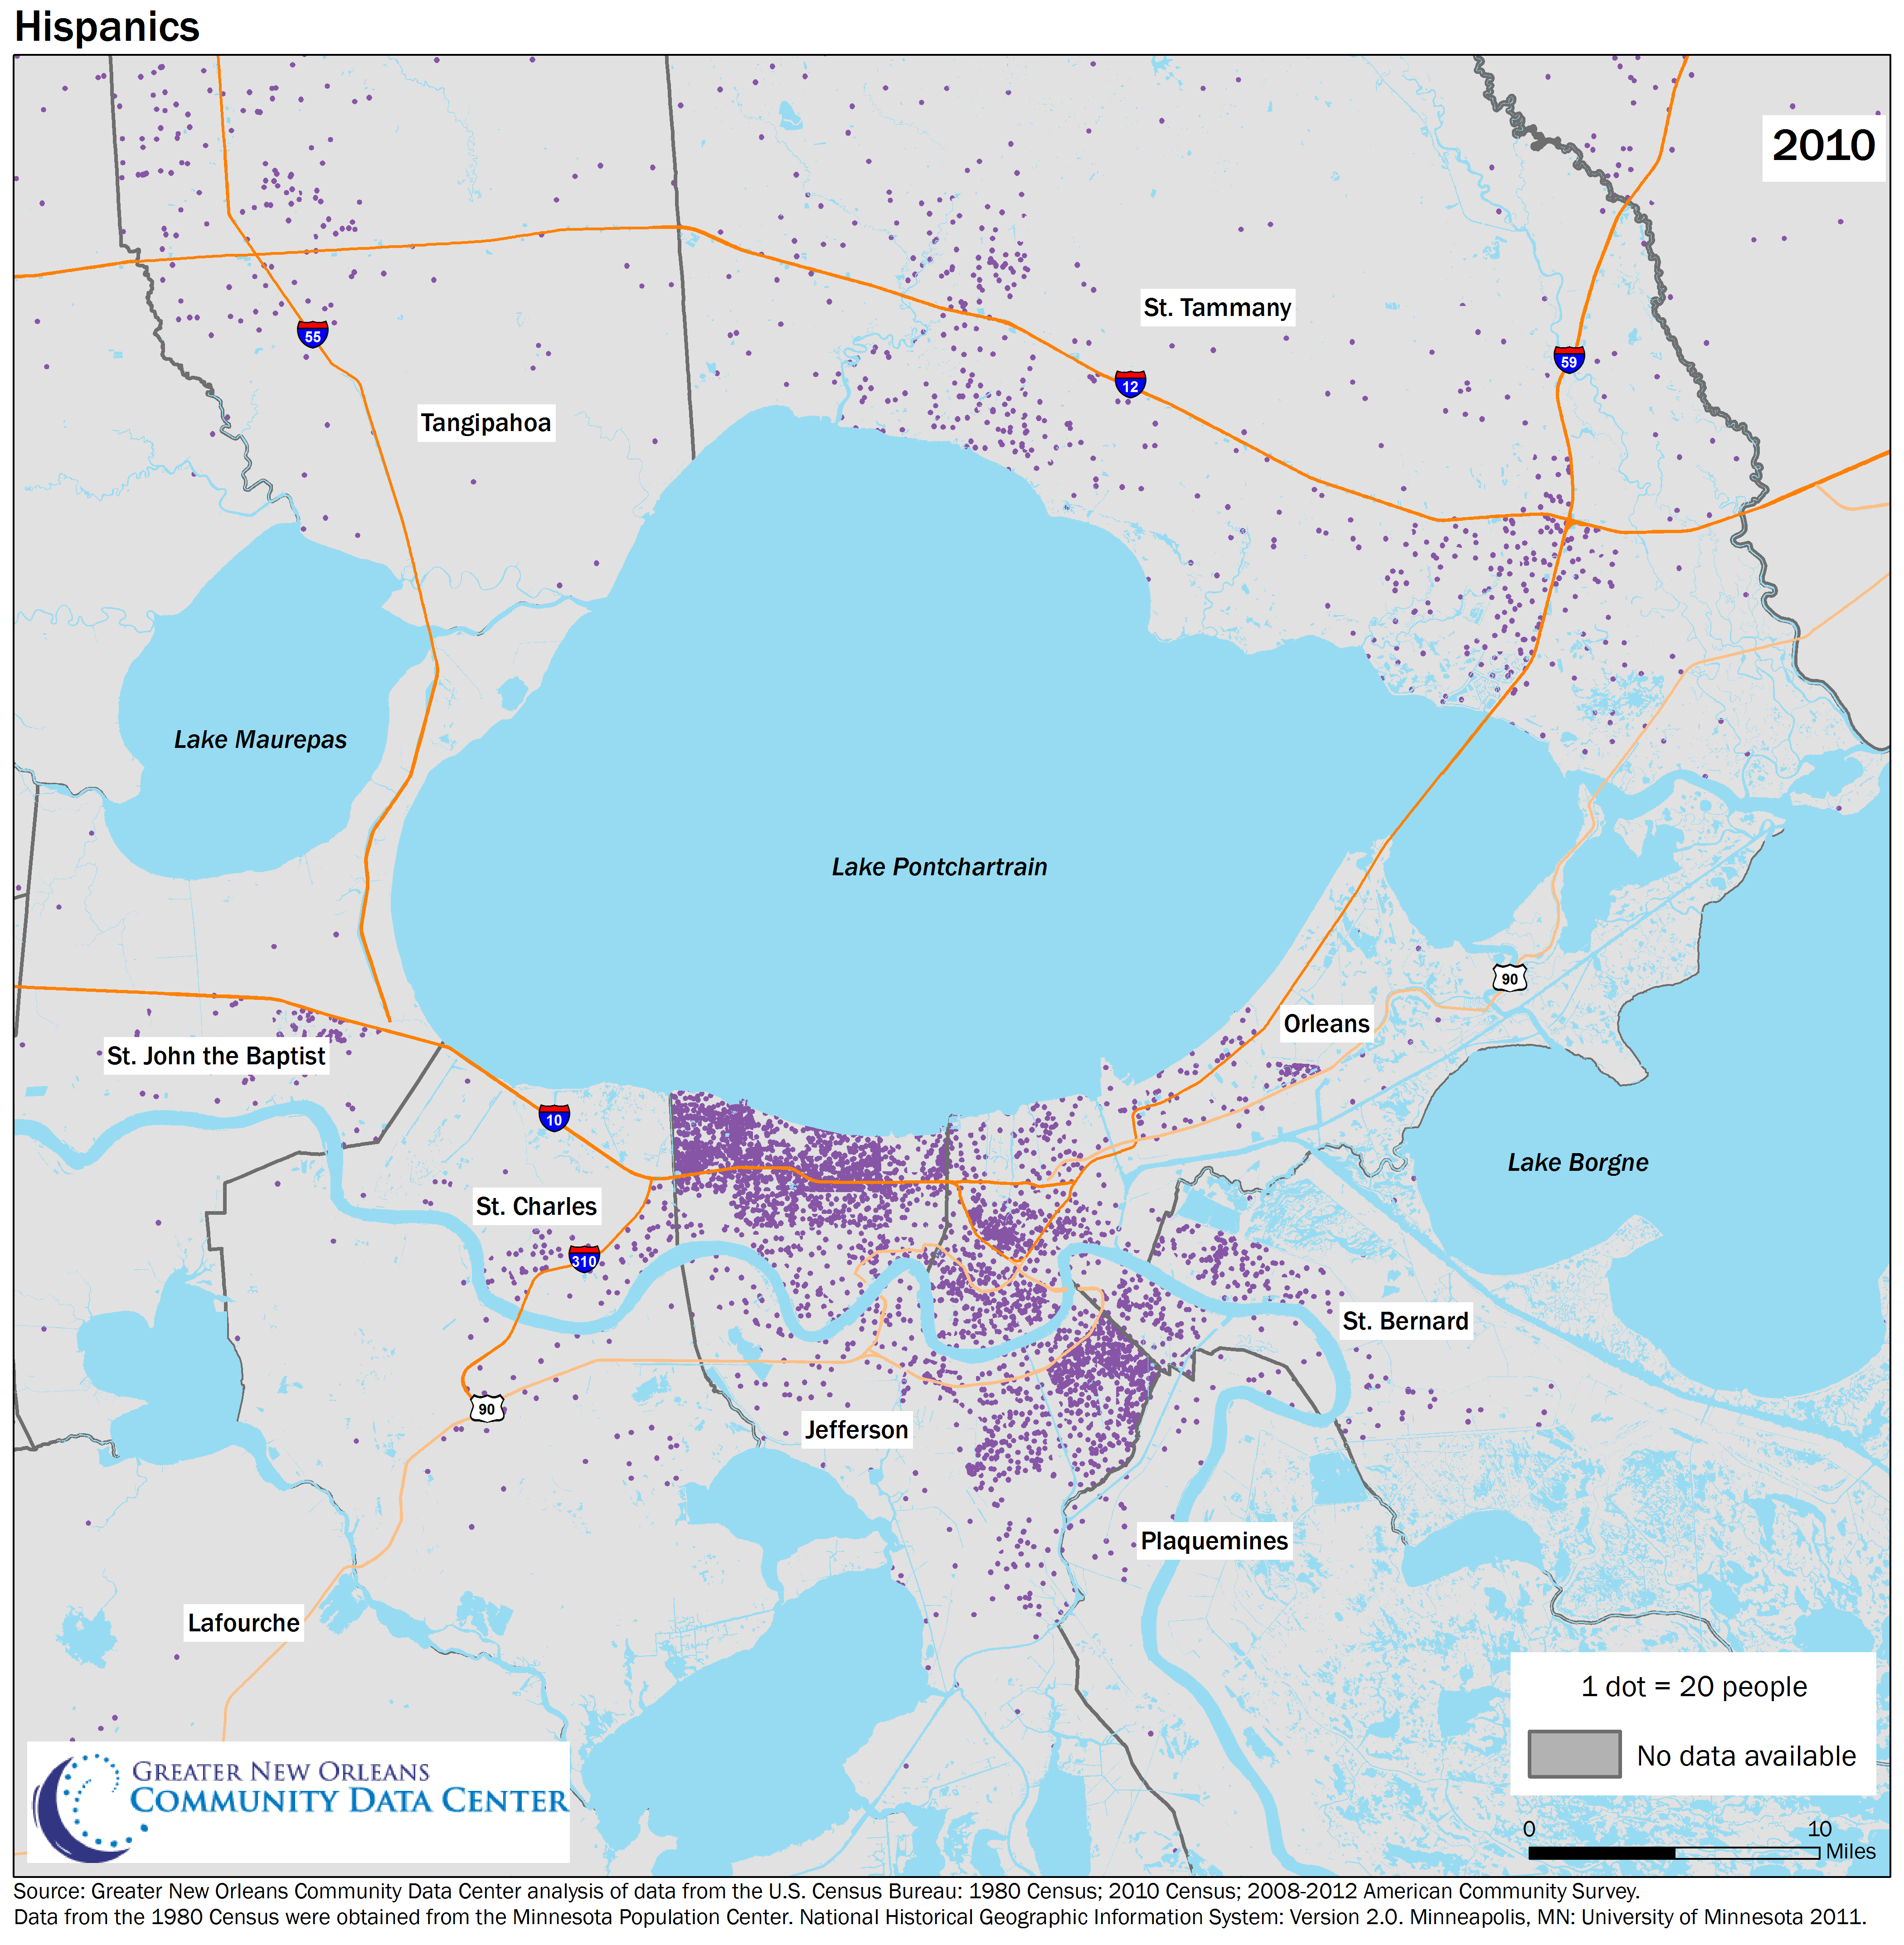
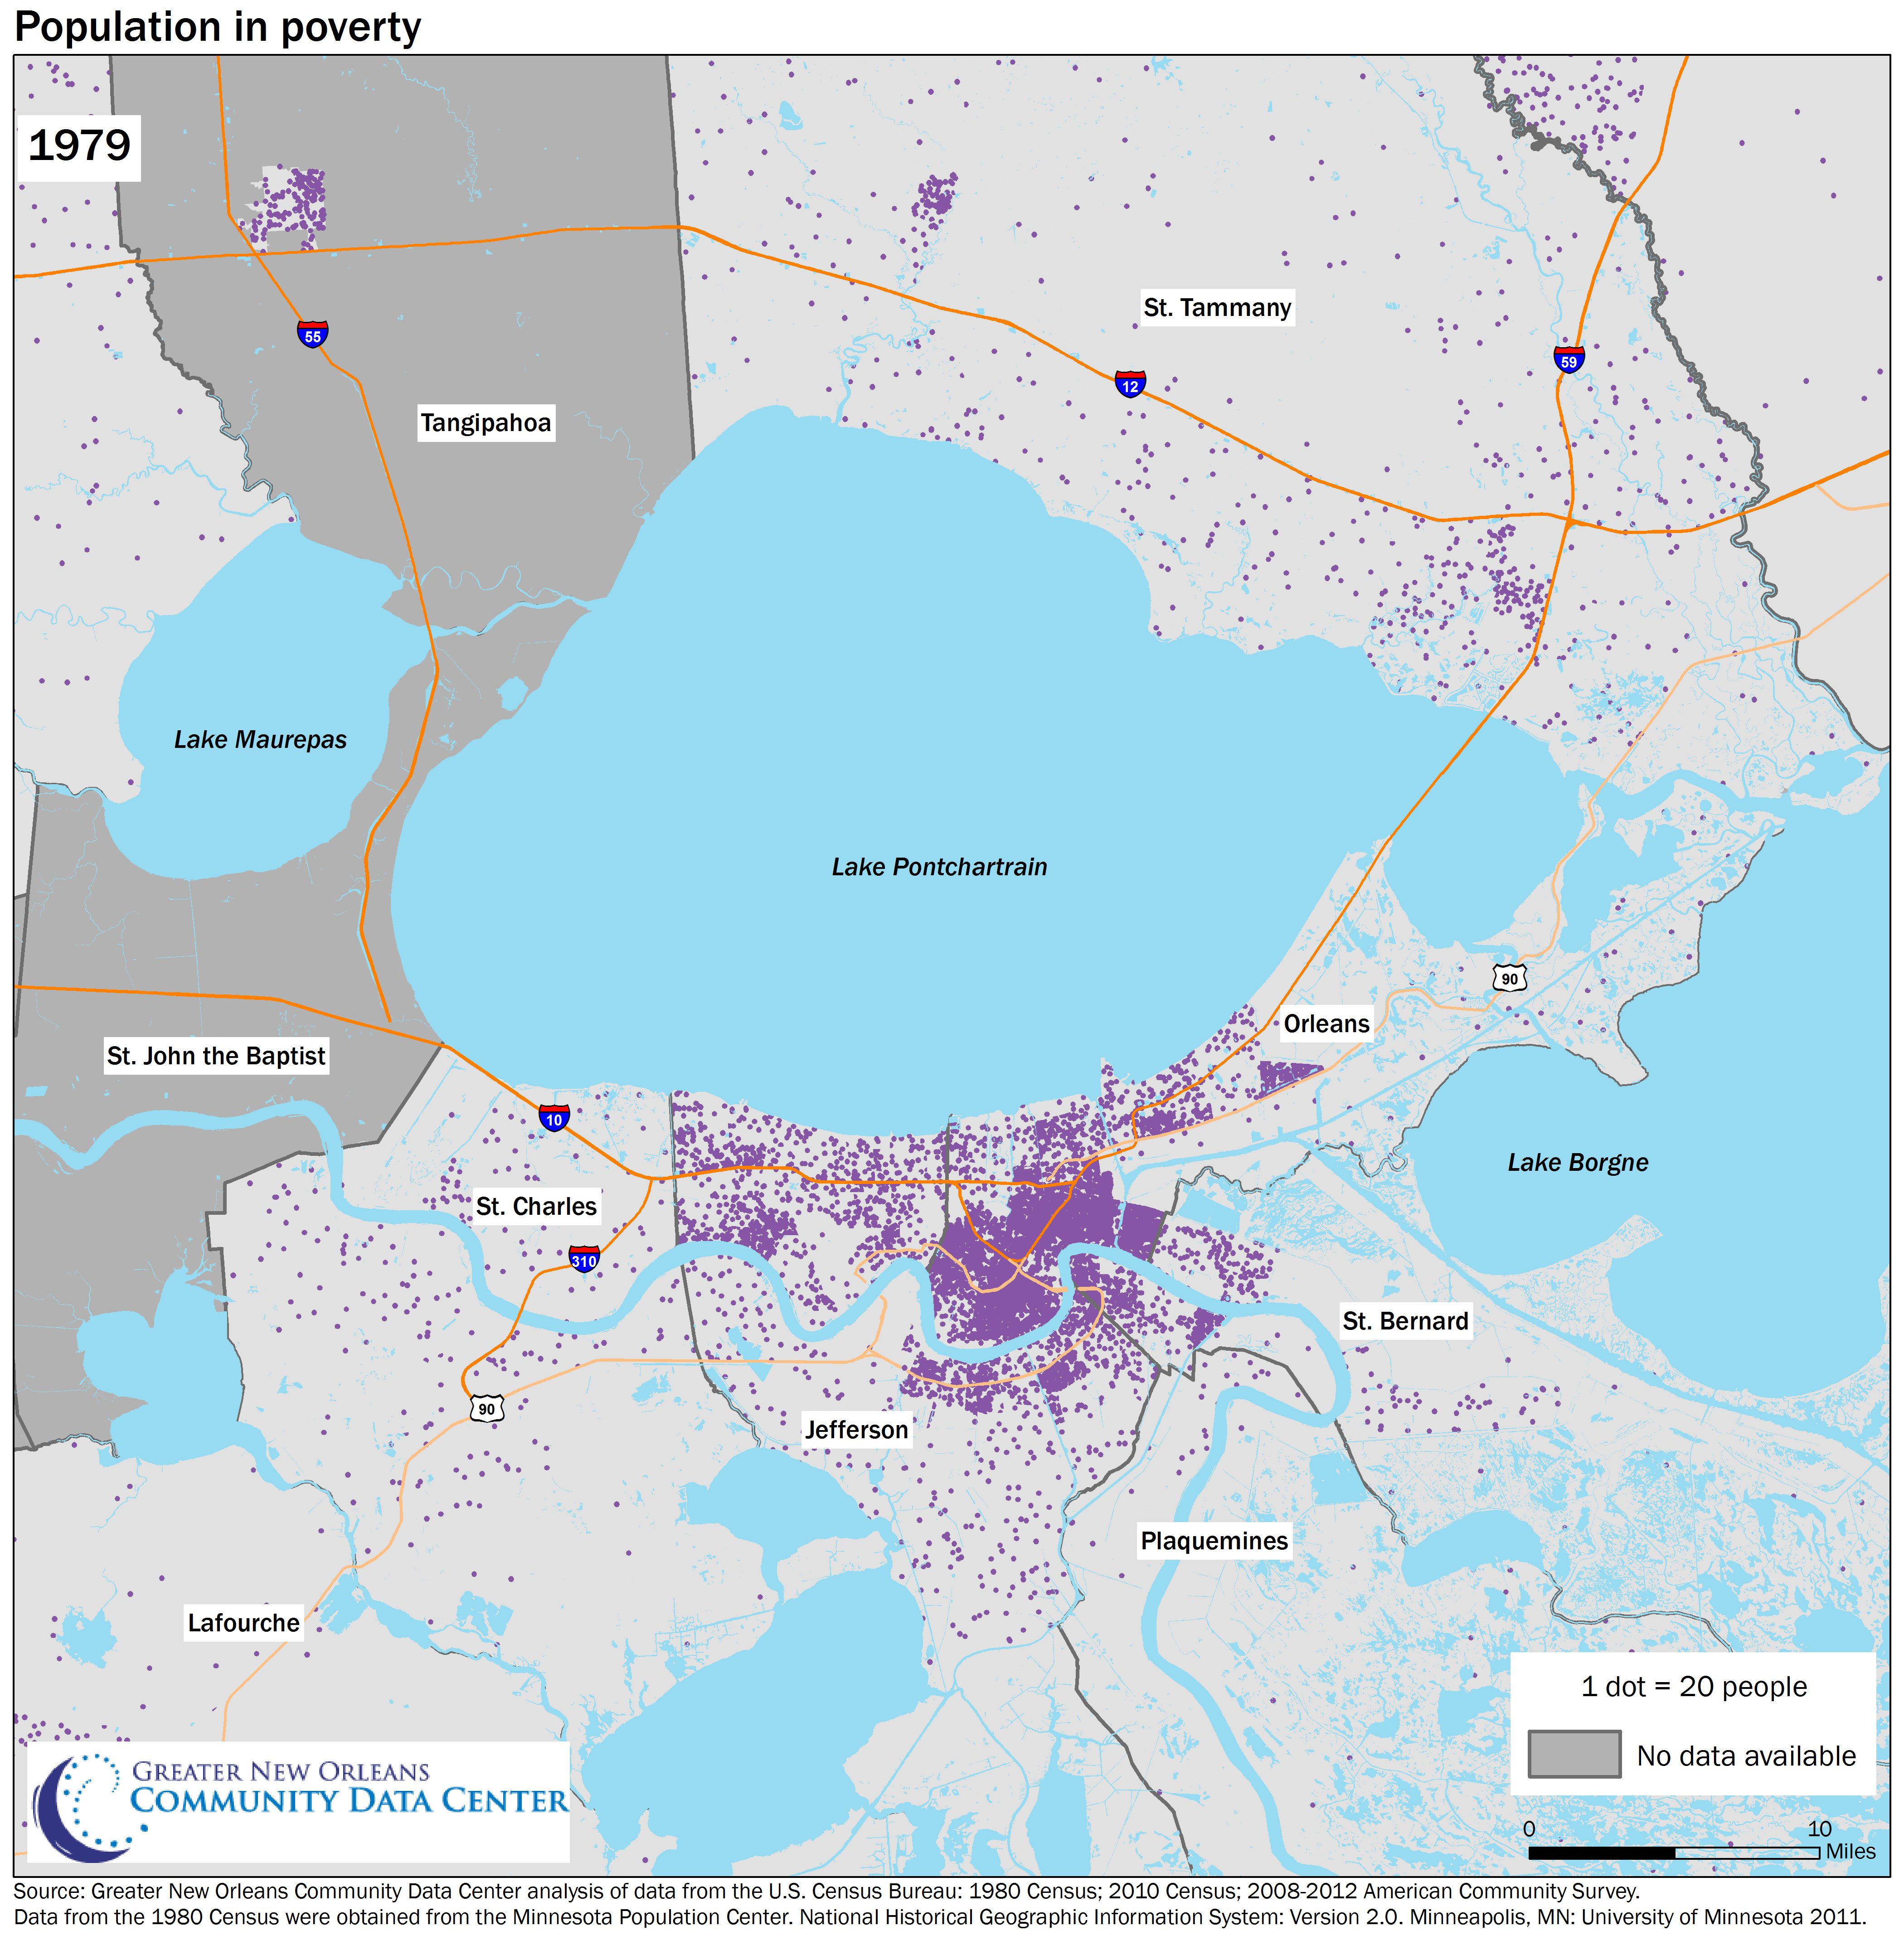
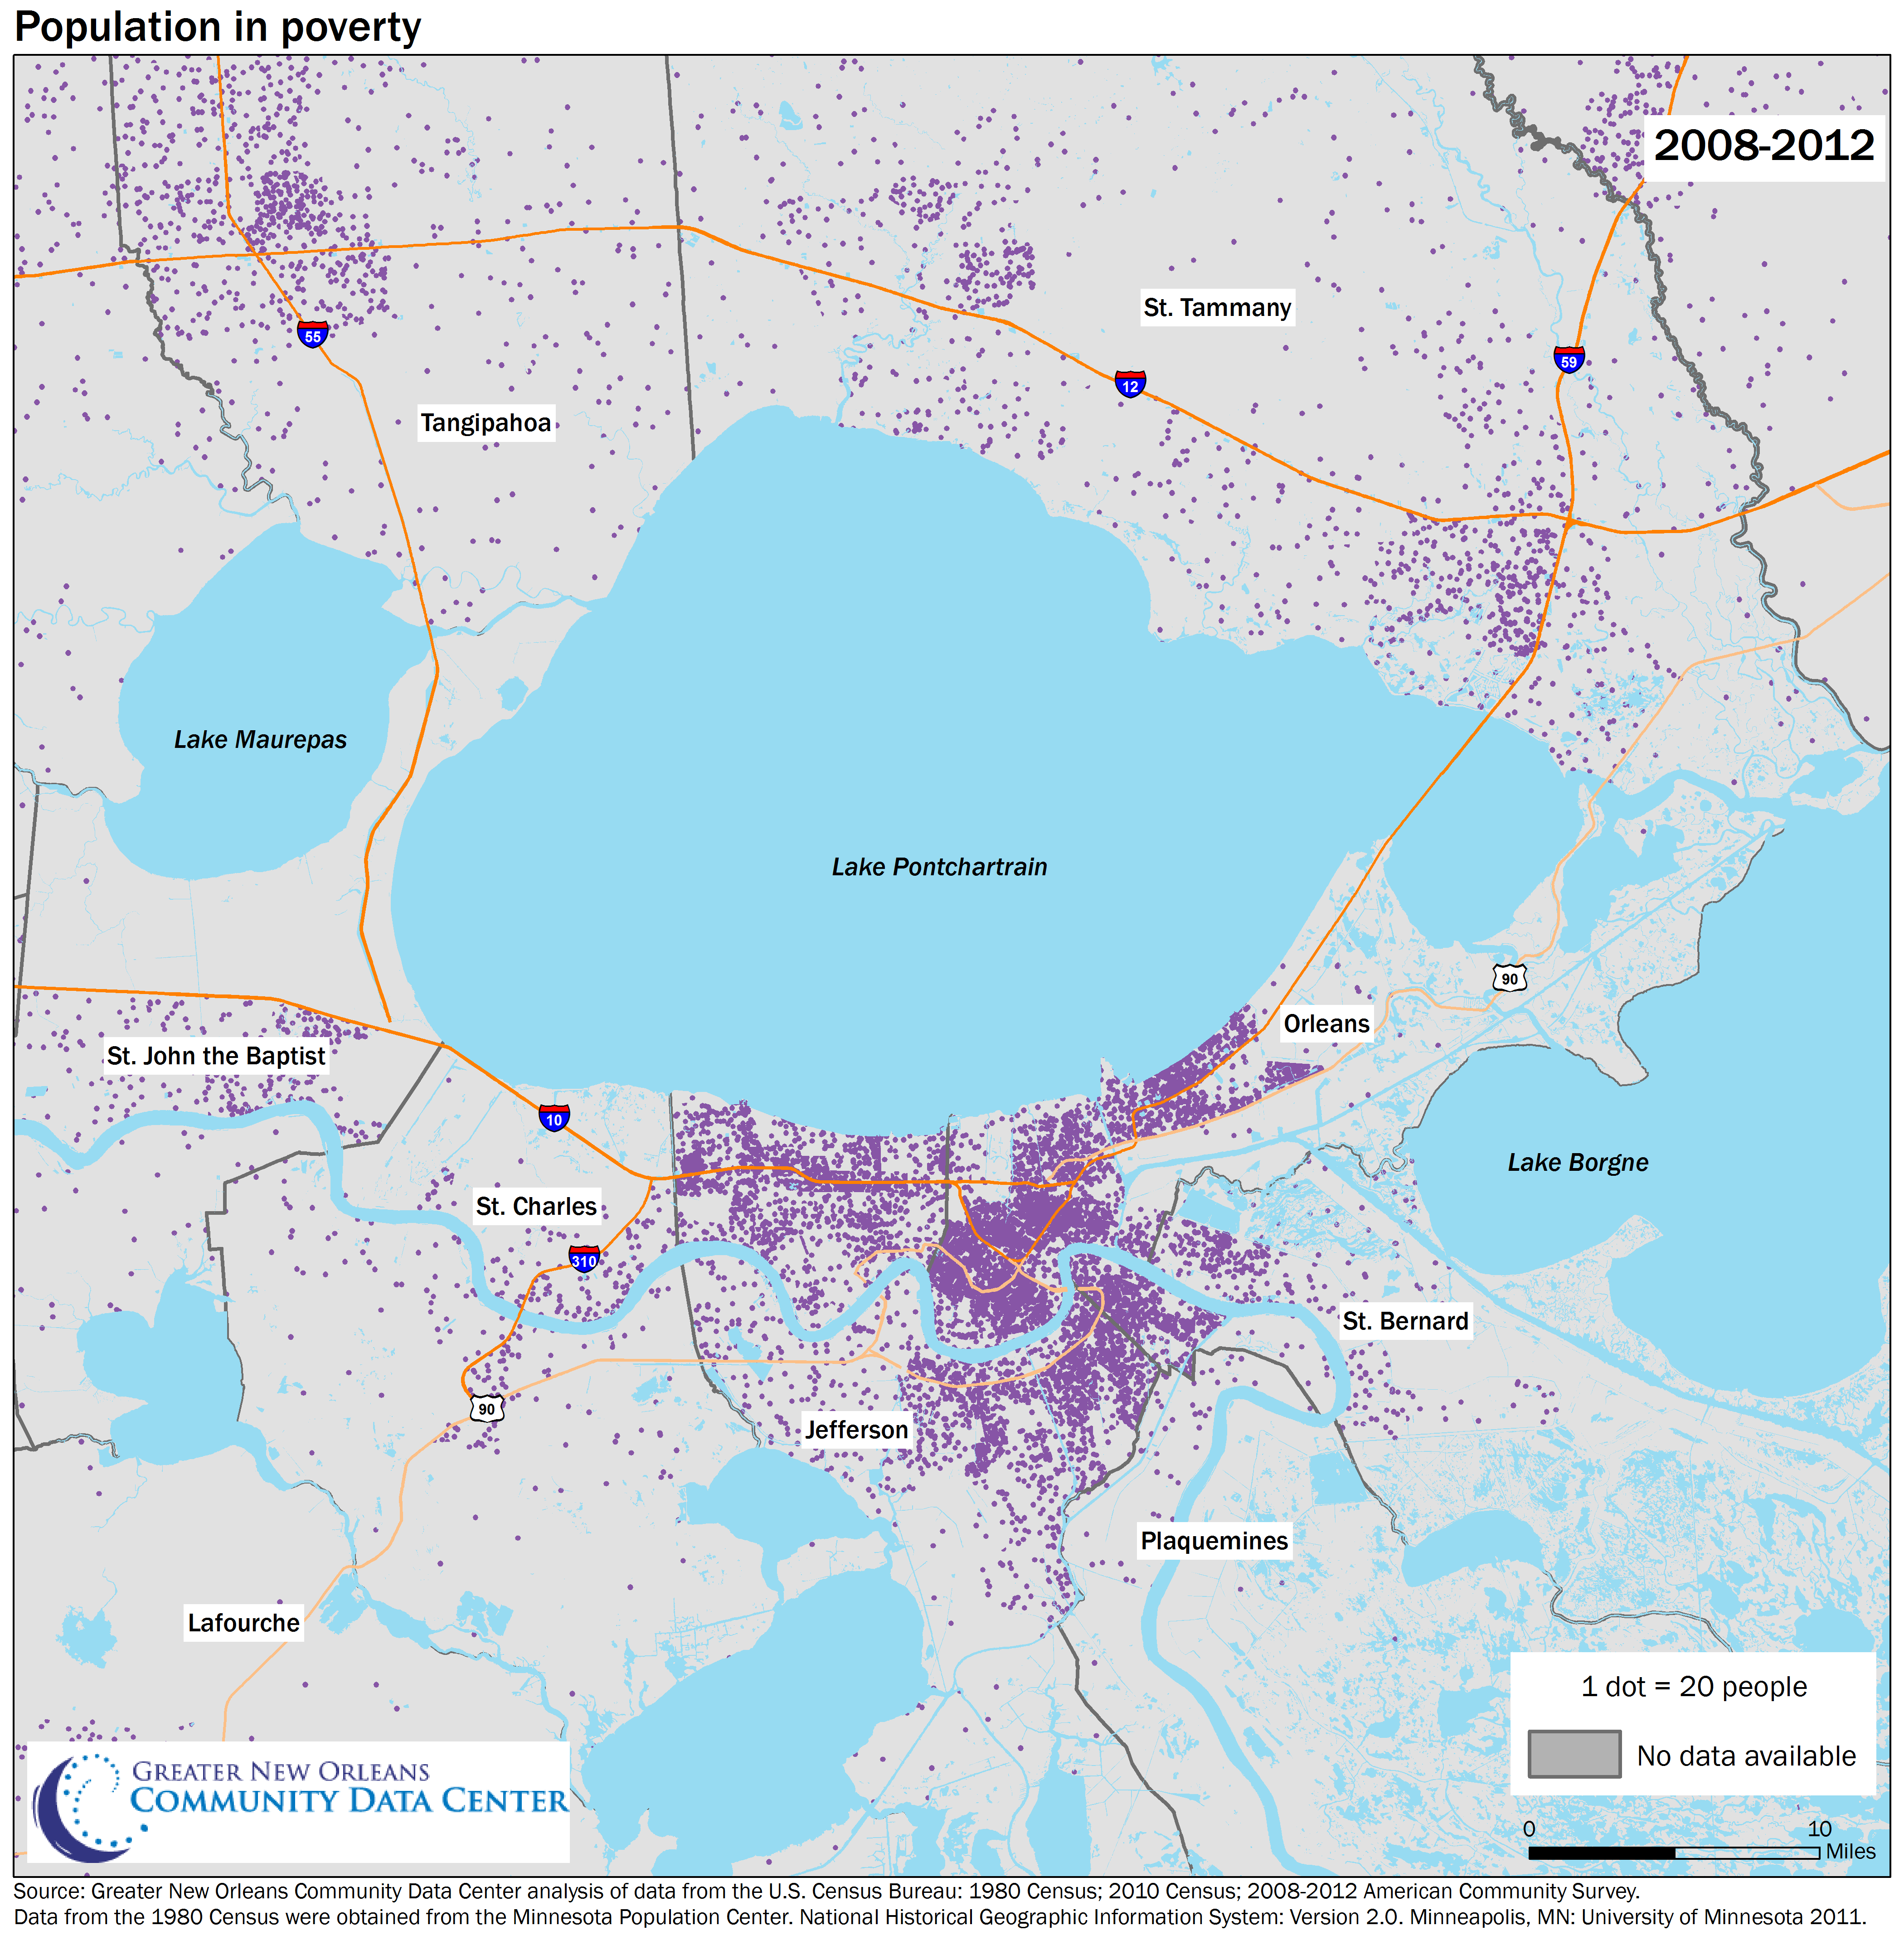
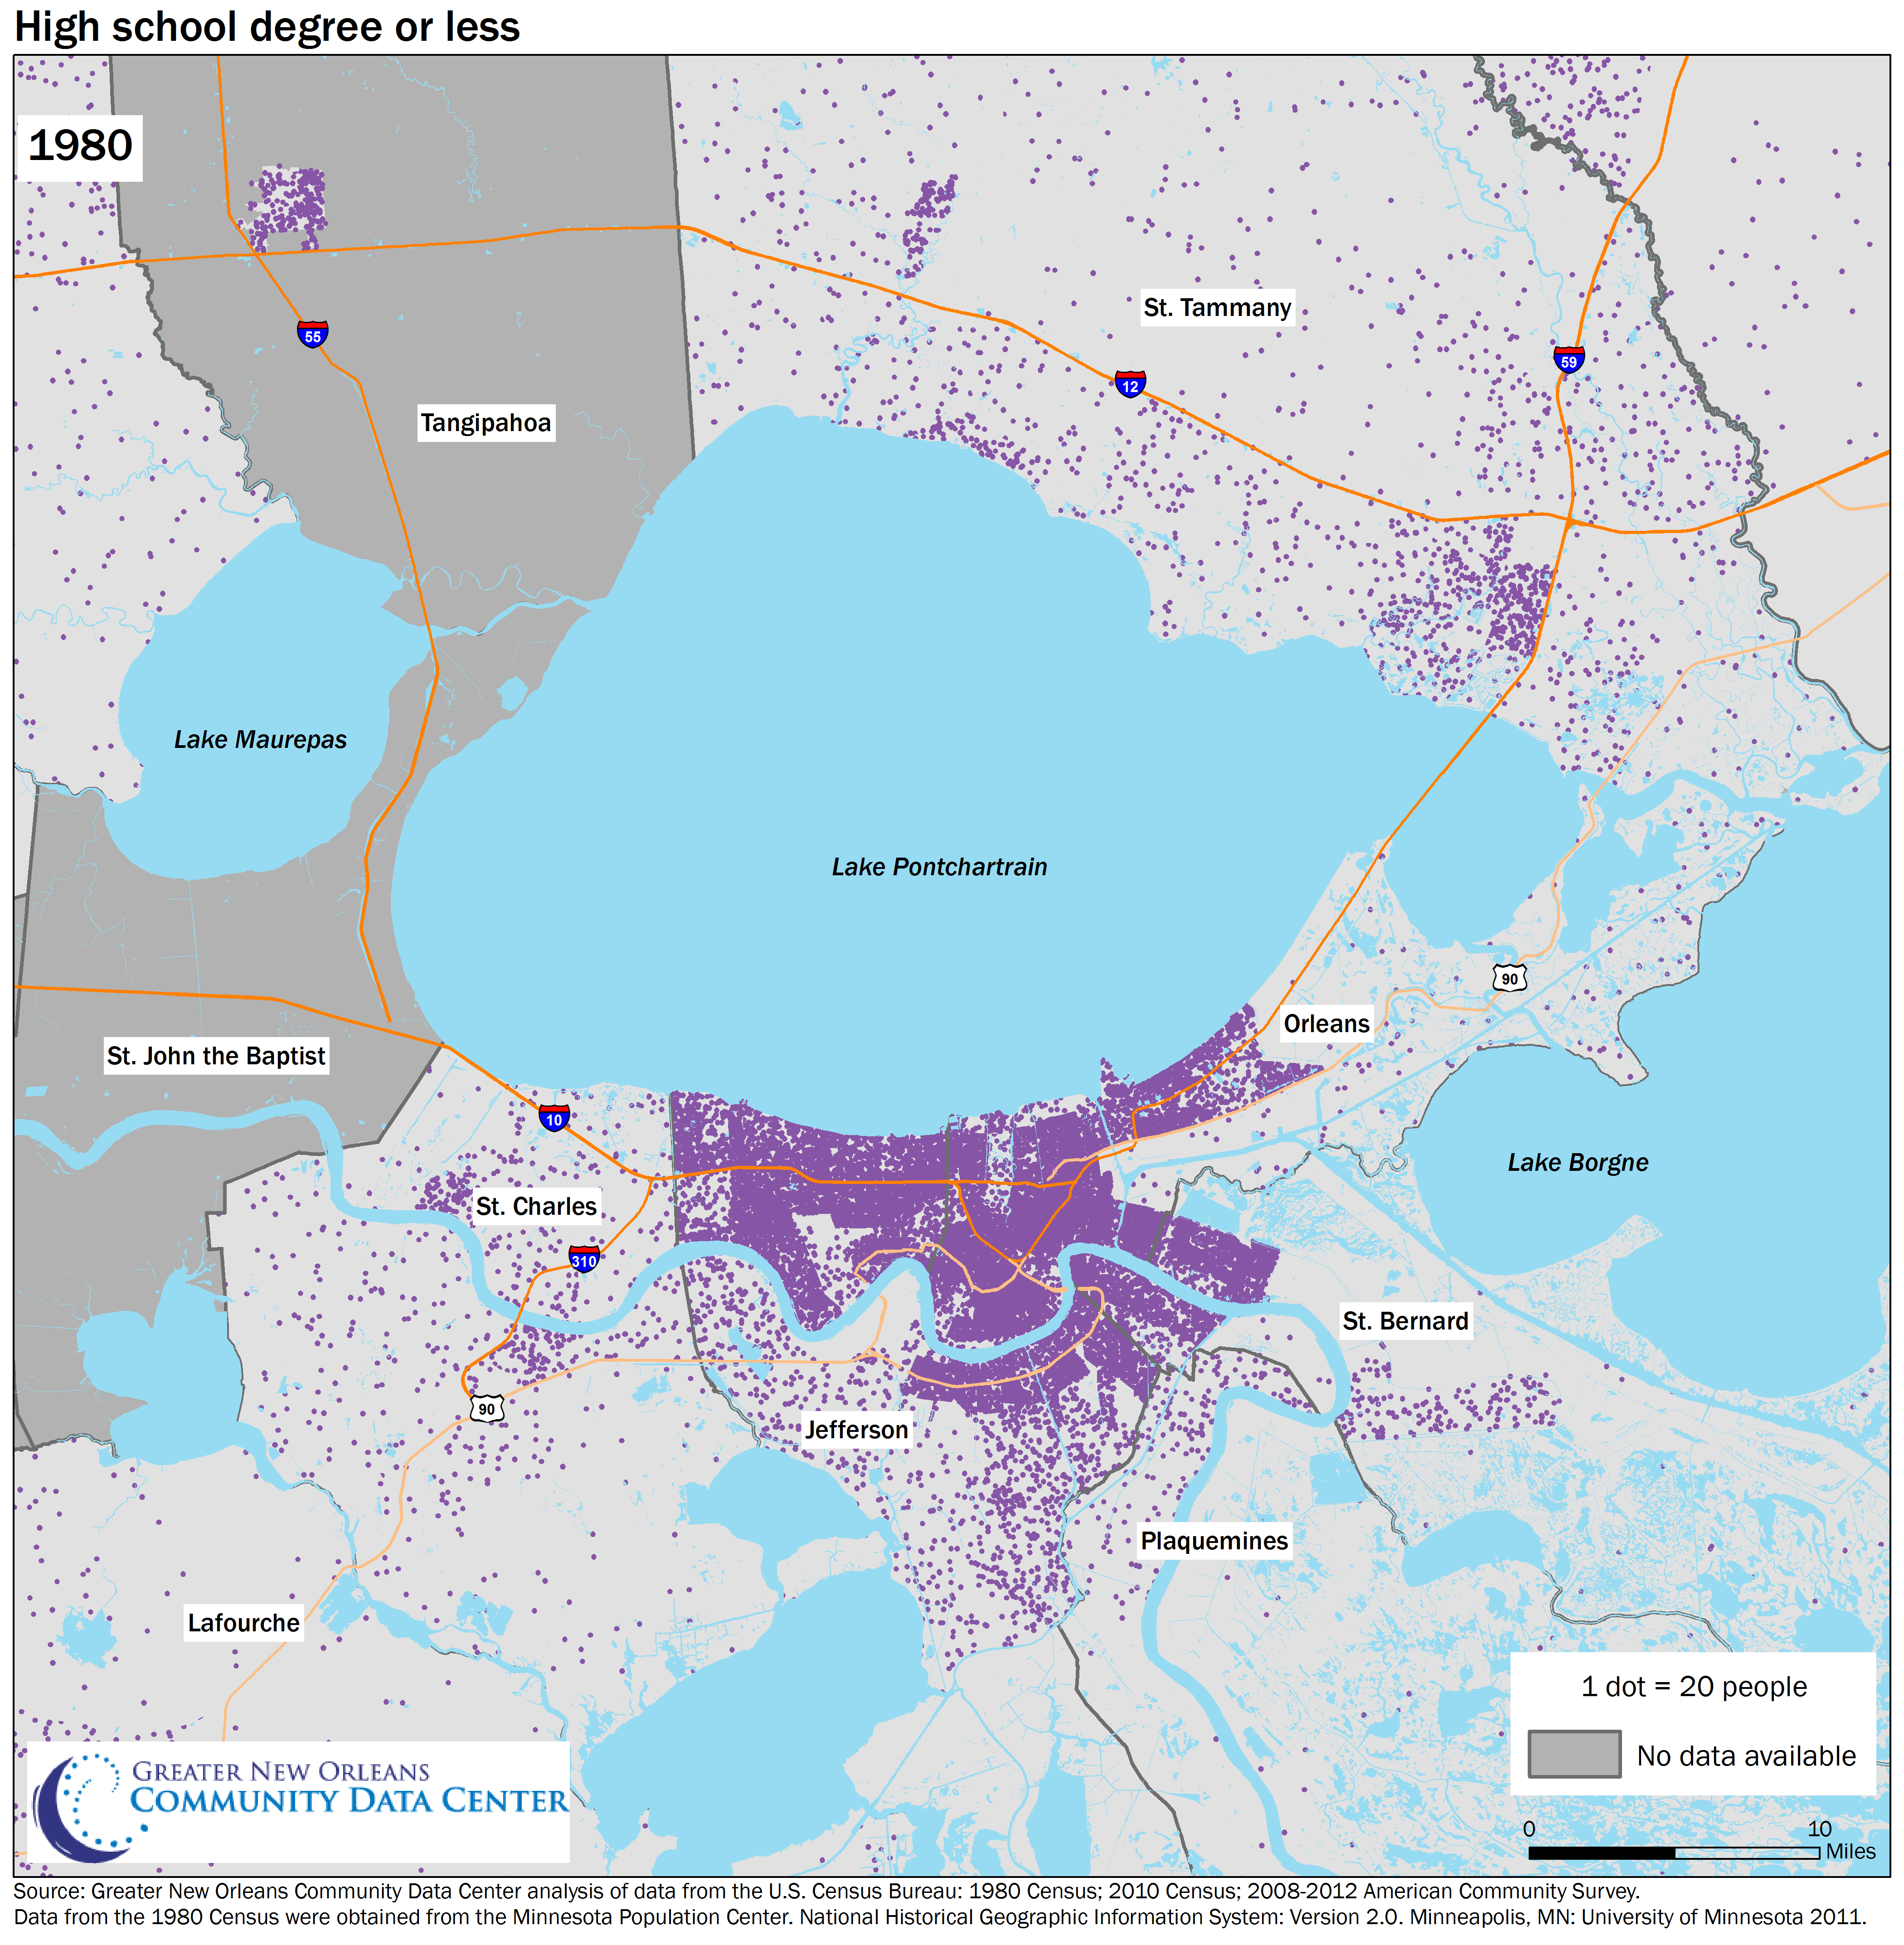
The New Orleans demographic, economic, and social landscape has changed significantly since 1980. The maps below show these spatial changes from 1980 through today. Start with the map showing population in 1980 and 2010 using the bar to explore how the region looked in 1980 and today. Then explore the rest of the collection using the dropdown menu.
Select from the maps below:
To see detailed maps of poverty within Orleans Parish, see…
Geographies of Poverty